The dollar has managed to ease its free fall over the last several days, which has prompted some traders to expect that the worst for the greenback is now over. Even though it would be premature to argue that a complete trend reversal is due, global developments could continue to affect the dollar positively in the near future.
The Chair of the Federal Reserve Jerome Powell is due to deliver a speech titled "Monetary Policy Framework Review" at the Jackson Hole Symposium on Thursday, which is likely to stir heightened volatility in currency markets. Traders would be eying for cues in Powell's remarks concerning FED's projections for recovery.
The FOMC had previously stated that it anticipates a protracted and uneven recovery, which could also encompass a double-dip economic crunch. In other words, the markets would be looking for evidence in Powell's speech regarding FED's opinions on the likelihood of a second downturn in Q3.
Regardless of Powell's underlying tone on Thursday, his statements are likely to prompt considerable fluctuations on all currency pairs involving the dollar. As regards the AUDUSD, the pair continues to consolidate between the boundaries of a major Distribution range. The expected surge in volatility coupled with the ongoing strengthening of the greenback, could propel the price action outside the boundaries of set range.
That is why the purpose of today's analysis is to examine the behaviour of the price action in relation to the Wyckoff cycle, and to establish the likelihood for the transition of the price action into a new stage of the cycle.
1. Long-Term Outlook:
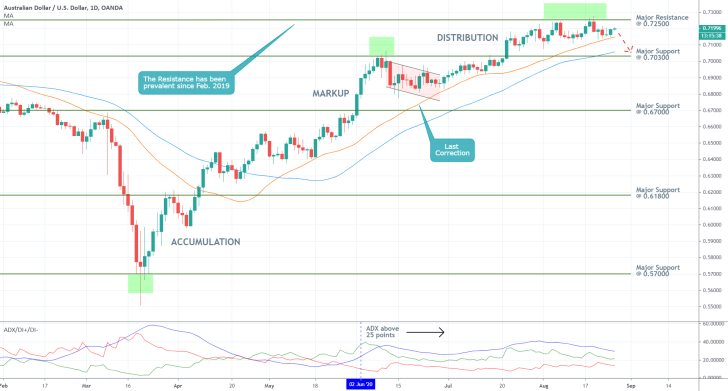
As can be seen on the daily chart below, the price action is consolidating within the boundaries of a broad Distribution range, which spans between the major resistance level at 0.7250 and the major support level at 0.70300. It has already failed to break out above the former, which has been prevalent for over a year and a half now, on two separate occasions. Given the recent strengthening of the greenback and the pair's inability to continue developing the Markup past the Distribution, supports the expectations for a rebound at least towards the Distribution's lower limit.
The price action has not been able to make significant progress in either direction since mid-July, despite the ADX indicator being above the 25-point benchmark. This has been the case since the 2nd of July, which exemplifies the trending conditions on the market.
This logical contradiction can be explained away with the gradual transition of the market between the different stages of the Wyckoff cycle; from Markup into Distribution in this case. This is an important distinction because it can be used to draw conclusions about the expected behaviour of the price action within the different stages of the cycle.

A major directional swing is likely to occur soon for two reasons. Firstly, the aforementioned speech of Jerome Powell could serve as a potential catalyst for such a movement. Secondly, the price action remains concentrated within an increasingly narrower area between the major resistance at 0.72500 and the 30-day MA (in orange). Once there is no more room left for the price action to fluctuate freely, the only reasonable outcome would be the development of a breakout/breakdown outside of this area.
At present, the creation of a sizable downswing towards the Distribution's lower limit seems more probable due to the aforementioned fundamentals. This would also represent an early attempt by the price action to transition from the Distribution into a new Markdown. However, it should be stressed that a significant increase in the underlying bearish sentiment is still needed for this to happen.
The price action is yet to break down below the 30-day MA, which hasn't occurred since the beginning of the previous Markup, let alone breaking down below the 50-day MA (in blue). The latter serves the role of an even more prominent floating support. Notice that it recently transitioned above the major support level at 0.70300, which means that there is now even more bullish pressure around that level. In other words, the strength of any new downswing is going to be tested there.
2. Short-Term Outlook:
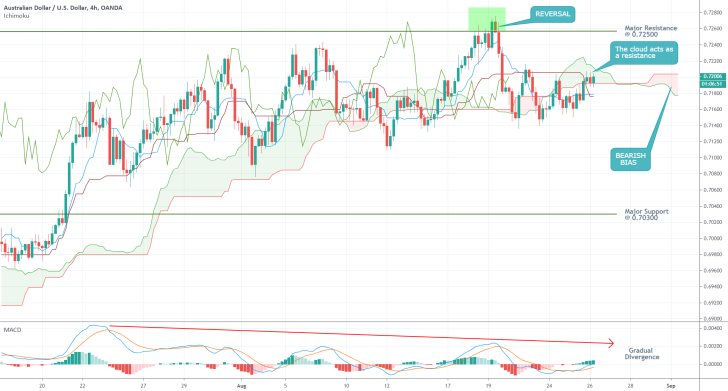
The 4H chart below presents even more bearish signals in the short-term. The most compelling one is the false breakout (reversal) above the major resistance level at 0.72500. Moreover, the MACD indicator is elucidating the gradual development of a new divergence, which represent an early indication of waning bullish momentum in the market.
Meanwhile, the Ichimoku Cloud indicator demonstrates the changing market pressures. As can be seen, there is mounting bearish bias at present. Furthermore, the remaining bullish cloud (around the current market price) is indirectly functioning as a floating resistance, which means that the price action is likely to establish another bearish reversal in the near-term.

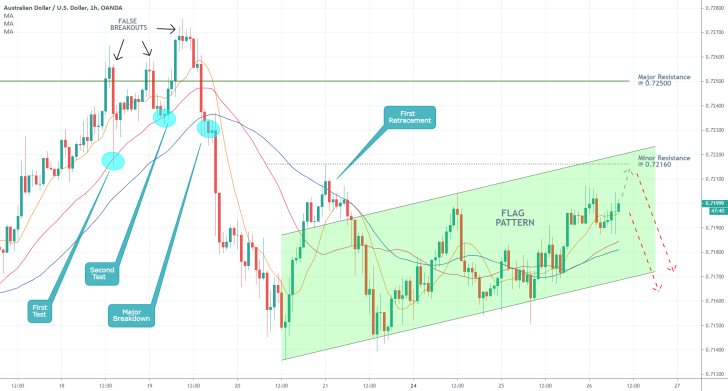
Finally, the hourly chart below highlights the likely manner in which the remaining bullish commitment in the market is likely to be terminated. The upper boundary of the currently emerging Flag Pattern coincides with the minor resistance level at 0.72160. These two represent a potential reversal level for the price action.
Notice that at present, the price action remains concentrated above the 10-day MA (in orange). The latter, in turn, is positioned above the 30-day MA (in purple), which is trading above the 50-day MA (in blue). This ascending order encapsulates the remaining bullish sentiment in the short term. Once this relationship is broken – similarly to the previous breakdown, also represented on the hourly chart – the bears could expect the development of a more sizable dropdown.

3. Concluding Remarks:
Distribution ranges by definition involve muted price action, despite the current reading of the ADX. That is why it would be unreasonable to expect the development of a new directional trend right away.
Nevertheless, this does not preclude the possibility for the emergence of sizable fluctuations within the boundaries of the present Distribution. In other words, the expected surge in volatility could potentially propel the AUDUSD towards the direction of the major support level at 0.70300.

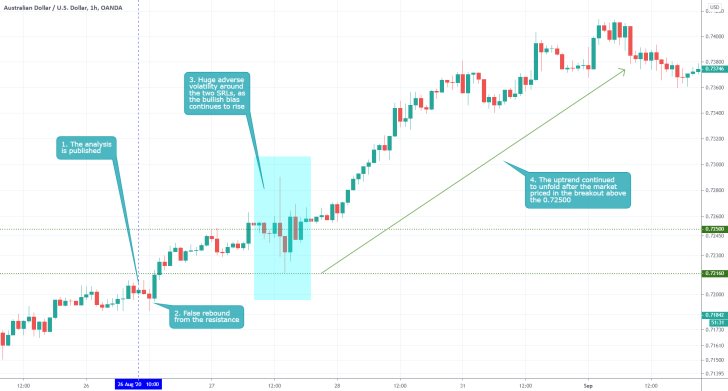
- The analysis completely misconstrued the underlying market sentiment. Instead of the anticipated bearish trend reversal, the market continued developing the preceding bullish trend. Whenever the trader completely fails to understand the underlying sentiment in such a way, it is better for him or her to take several days off trading in order to recoup.
Disclaimer: Your capital is at risk! Trading and investing on the financial markets carries a significant risk of loss. Each material, shown on this website, is provided for educational purposes only. A perfect, 100% accurate method of analysis does not exist. If you make a decision to trade or invest, based on the information from this website, you will be doing it at your own risk. Under no circumstances is Trendsharks responsible for any capital losses or damages you might suffer, while using the company’s products and services. For more information read our Terms & Conditions and Risk Disclaimer.


