The AUDNZD did not manage to break out above the Distribution range that was outlined in our last analysis of the pair's price action. As it was argued back then, the AUDNZD appears to be in the early stages of developing a new bearish trend, and this assertion is now further supported.
The underlying price action is increasingly exhibiting behavioural traits that are typically associated with prevailingly bearish market sentiments, which affirms the expectations for the formation of a new decisive breakdown.
The Australian dollar has been advancing steadily ever since the coronavirus crisis reached a peak in late-March, but this solid bullish run is now slowing down. The RBA is deliberating on its monetary policy stance tomorrow morning, which is likely to prompt heightened volatility on all currency pairs involving the Aussie, and potentially hasten the currency's selloff.
Meanwhile, the New Zealand dollar recouped after RBNZ's recent remarks concerning the 'unfavourable exchange rates' that are currently being faced by the country's economy. Additionally, New Zealand is among the few countries that are faring exceptionally well in controlling and offsetting the spread of COVID-19, which is yet another prerequisite for the future strengthening of the kiwi.
The underlying fundamentals are favourable for the development of a new bearish trend on the AUDNZD, which is making the trading opportunities on the pair even more exciting. That is why the purpose of today's analysis is to examine the behaviour of the underlying price action, and to underpin the most likely manner in which a new bearish trend is expected to develop next.
1. Long-Term Outlook:
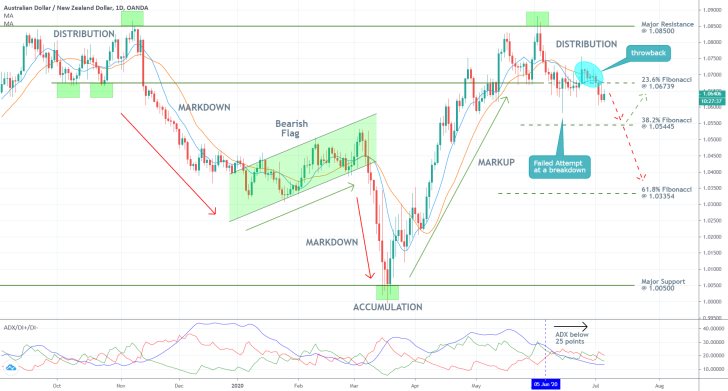
As can be seen on the daily chart below, the aforementioned Distribution spans between the major resistance level at 1.08500, and the major support level at 1.06739. The latter also serves as the 23.6 per cent Fibonacci retracement level, which makes it psychologically important.
The most substantial piece of evidence supporting the expectations for the formation of a new markdown stems from the fact that previously there was another Distribution range with the same boundaries. The initial Distribution prompted a trend reversal, which eventually reached a gap during the height of the coronavirus crisis. Hence, the market is very likely to behave in a similar fashion yet again.

The underlying price action formed a throwback above the range's lower boundary after the last failed breakdown, which is a behaviour that is to be expected at times when the prevailing market sentiment is changing – in this case, from bullish to bearish. Following the termination of the throwback, the price action formed a decisive breakdown, which is the first significant steppingstone in a new bearish trend's development. At present, the price action is consolidating just below the 23.6 per cent Fibonacci retracement level.
The ADX indicator has been threading below the 25-point mark since the 5th of June, which underlines the underlying range-trading environment (the Distribution itself). Naturally, once the ADX starts advancing once again, this would mean that the AUDNZD is definitively transitioning from the Distribution phase of the Wyckoff cycle into a new Markdown stage.
This could happen in one of two ways. The price action could either continue to consolidate around the 23.6 per cent Fibonacci retracement level or it could start trading lower straightaway. If the latter is the case, then a dropdown towards the 38.2 per cent Fibonacci retracement level at 1.05445 can be expected next. Afterwards, the market could either form a minor bullish correction from the support at 1.05445 or break down even lower. Subsequently, the AUDNZD could head towards the next prominent support level – the 61.8 per cent Fibonacci retracement at 1.03354.
2. Short-Term Outlook:
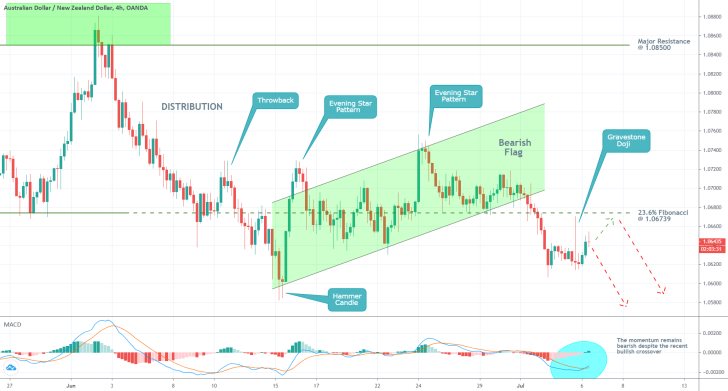
As can be seen on the 4H chart below, the recent breakdown below the Distribution range's lower boundary also encompasses a logical progression in the development of a Bearish Flag Pattern. In other words, the breakdown below the ascending channel's lower limit, which coincided with the breakdown below the 23.6 per cent Fibonacci, supports the expectations for further dropdowns.

The 23.6 per cent Fibonacci retracement could potentially be tested as a possible resistance level. If this were to happen, then we might witness the emergence of a minor bullish correction now before the development of the broader bearish trend is resumed. This is completely inlined with the current behaviour of the MACD indicator, which is predominantly demonstrating bearish momentum in the market. Nevertheless, the recent bullish crossover could temporarily offset the further development of the underlying bearish momentum.
The prominent candlesticks that are sketched on the chart above demonstrate the twists and turns in the development of the price action. The next such change in AUDNZD's underlying direction is likely to drive the pair further south, judging by the fact that the most recent prominent candle is a Gravestone Doji.
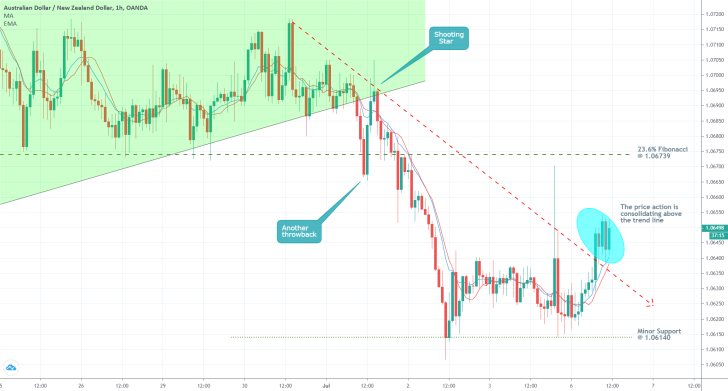
The temporarily rising bullish momentum in the very short-term is manifested on the hourly chart below. As can be seen, the price action broke out above the descending trend line, which means that the bearish trend's development is momentarily suspended. Once the pair breaks down below the trend line yet again, the Markdown's development could be said to be resumed. This would be confirmed by a crossover of the 10-day EMA (in blue) below the 10-day MA (in orange).

3. Concluding Remarks:
The AUDNZD pair is currently in the process of establishing a new bearish trend, however, this does not necessarily mean that such a trend would be developed right away. Neither that a bullish trend reversal is entirely implausible.
The market bears would do well to wait and see how the market behaves next before they start placing large selling orders. Once the aforementioned bullish correction in the short-term is terminated, and the price action resumes heading south, then would be a good time to enter the market on the anticipations for the emergence of a new and massive bearish trend.

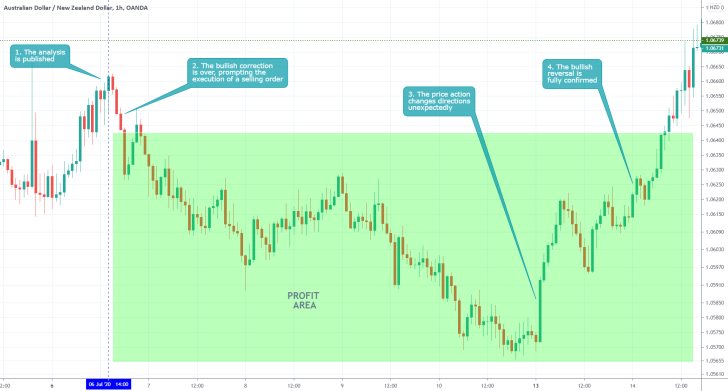
- The analysis did an excellent job of cautioning against sudden trend reversals. This scenario elucidates the importance of exerting tight control over open positions. Chiefly, the need to move the SL after the price has already moved by 50+ pips in your favour. That is so because, as can be seen, the price suddenly changed directions before falling to the support level at 1.05445.
Disclaimer: Your capital is at risk! Trading and investing on the financial markets carries a significant risk of loss. Each material, shown on this website, is provided for educational purposes only. A perfect, 100% accurate method of analysis does not exist. If you make a decision to trade or invest, based on the information from this website, you will be doing it at your own risk. Under no circumstances is Trendsharks responsible for any capital losses or damages you might suffer, while using the company’s products and services. For more information read our Terms & Conditions and Risk Disclaimer.


