The AUDCAD has had a tremendous bullish run over the last quarter, as the pair rose by more than 10 per cent since April. This was mostly owing to the robust global recovery of most of the hardest-hit assets, which were left reeling in the wake of the first coronavirus crash in early-March.
The Australian dollar, which was one of those most affected financial instruments, rebounded due to a mixture of contributing factors. Chiefly, the accommodative monetary policy of the Reserve Bank of Australia; the recuperated Chinese industrial activity; and the falling number of COVID-19 cases in the country all attributed to the strengthening Aussie. Meanwhile, the Canadian dollar remained undervalued during the same period as low oil prices kept pressuring the Loonie.
Now the tables could be turning, which would naturally lead to a correction in AUDCAD's price action. The Governing Council of the RBA is expected to maintain the near-negative Cash Rate unchanged during its monetary policy meeting tomorrow morning, which would increase the underlying volatility on the pair.
Meanwhile, a recent resurgence in the number of COVID-19 cases in Victoria has prompted the premier of the state to order a "state of disaster" in Victoria. A curfew has been enforced in Melbourne, the second-largest city in Australia, alongside the reintroduction of other containment restriction measures. Overall, Australia continues to edge closer to a second epidemic wave in the cooler weather, which would jeopardise the recent bullish run of the Aussie.
In Canada, the government is scheduled to release crucial employment numbers on Friday, which could strengthen the Loonie if it is revealed that the unemployment rate in the country had decreased over the previous month.
The underlying fundamentals thus seem to favour the establishment of a probable correction on AUDCAD's price action. Currently looks like the perfect time for a short-term bearish correction as the pair recently reached a 2-year peak.
1. Long-Term Outlook:
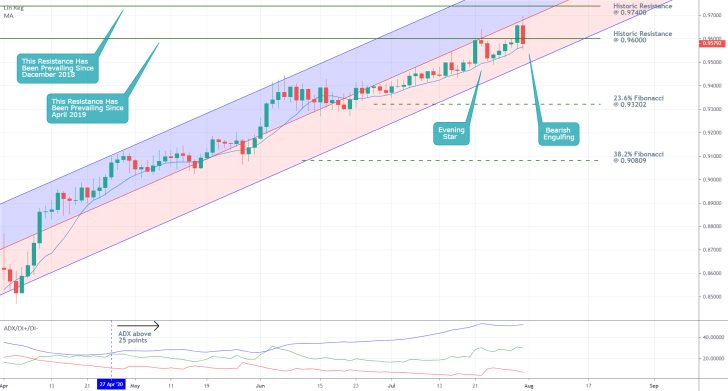
As can be seen on the daily chart below, last week, the underlying price action came close to reaching the historic resistance level at 0.97400, which has been prevalent since December 2018. After a snap rebound last Friday, the pair broke down below the historic resistance level at 0.96000 once again. The latter has been prevailing since April 2019.
These two levels are essential barriers for the current bullish trend, and they have the psychological significance to prompt the development of a temporary bearish correction before the price action can continue climbing. Such a turnaround seems overdue, judging by the fact that the bullish trend has been advancing steadily since mid-April without completing a single significant correction.

On the one hand, there are two major pieces of evidence signalling the likely development of such a downswing next. Firstly, the emergence of an evening star pattern and the bearish engulfing, both of which are typically found towards the end of a recent uptrend, around the historic resistance level at 1.96000 entails the accumulation of selling pressure. These patterns represent increasing bearish sentiment in the market and are commonly associated with likely reversals in the underlying direction of the price action.
Secondly, the price action remains concentrated below the ascending channel's middle line, which serves the role of a floating resistance level. The inability of the AUDCAD to break out above it is an indication of rising bearish bias, which could initiate a temporary reversal towards the channel's lower edge.
On the other hand, the price action is positioned above the 10-day MA (in blue), which, in turn, is acting as a floating support level. For as long as this relationship between the two is maintained, no significant bearish correction can take place.
Additionally, the ADX indicator has been threading above the 25-point benchmark since the 27th of April, which elucidates the robustness of the prevailing bullish trend. This does not preclude the possibility for the formation of bearish corrections; however, it should serve as a caution for bears planning to use contrarian trading strategies.
2. Short-Term Outlook:
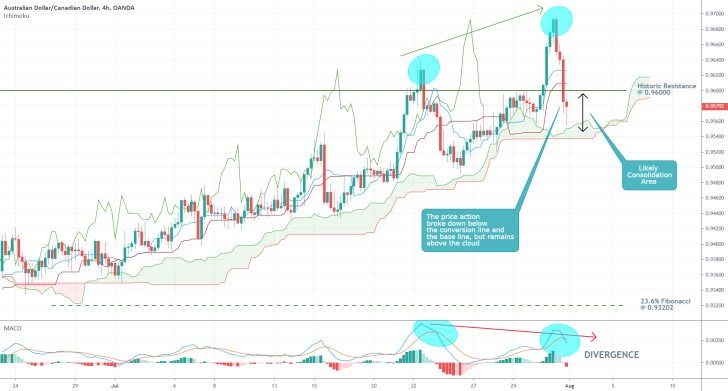
As can be seen on the 4H chart below, the broader (and still prevalent) bullish bias is represented using the Ichimoku cloud indicator. The cloud itself is green, which signals that the price action is likely to continue appreciating in the future. However, there is a gap between the current market price and the cloud's lowest limit, which means that there is still a spare room for the AUDCAD to continue falling.
This gap is represented on the chart as a likely consolidation area. In the longer run, this area could evolve from a minor consolidation range into the beginning of a more sizable bearish correction, provided that the underlying fundamentals continue to favour the depreciation of the Aussie and the appreciation of the Loonie.
Meanwhile, the MACD indicator highlights a currently developing divergence, which could be perceived as the beginning of such a correction. As can be seen, the price action has recently established two consecutive peaks (highlighted in blue), with the latter being higher than the former. Respectively, the corresponding MACD waves have lower peaks (again in blue), which underscores the currently evolving divergence.
In other words, the bullish momentum is waning, which, coupled with the other factors, could lead to the creation of a more sizable bearish correction.

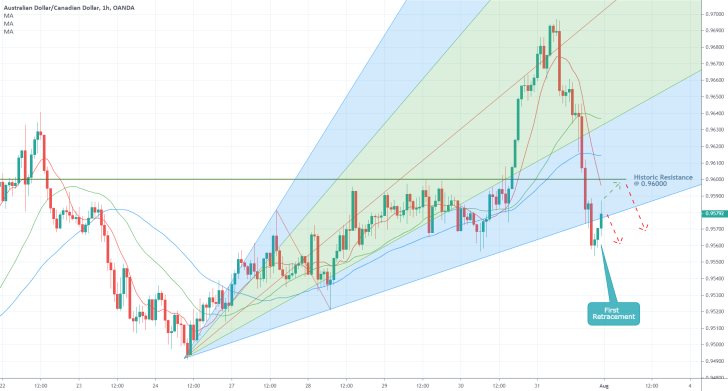
The main projections are further substantiated by the latest behaviour of the price action. The AUDCAD is currently attempting to consolidate below the boundaries of the pitchfan tool, as can be seen on the hourly chart below. After the latest retracement is completed, the price action would be able to continue probing lower.
Accordingly, the 10-day MA (in red) recently crossed below the 30-day MA (in green) and below the 50-day MA (in blue). The fact that the price action is currently trading below the three is illustrative of the rising bearish sentiment in the short-term. Nevertheless, this would be further substantiated once the three MAs adopt a perfect descending order – the 10-day MA being positioned below the 30-day MA, which, in turn, needs to be placed below the 50-day MA.

3. Concluding Remarks:
The fundamental landscape of factors currently affecting the price action of the AUDCAD is changing. Surging cases in Australia, coupled with the market's forward-looking expectations concerning the stabilisation of the Canadian labour market, could shift the underlying buying and selling pressures that have initiated the pair's bullish run.
Once these factors change, the likelihood for the creation of a new bearish correction would be increased. This process, however, is likely to take time and would probably be accompanied by heightened price fluctuations.

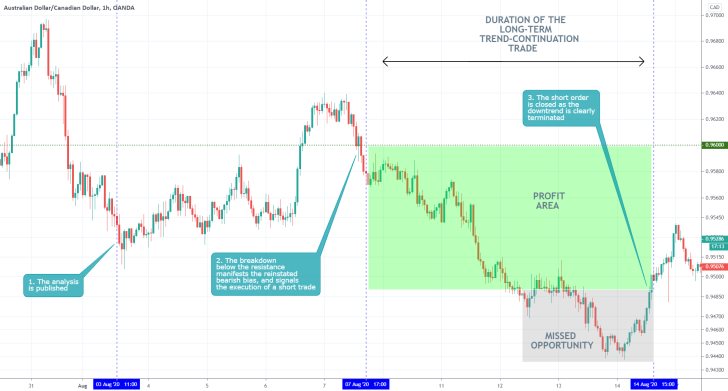
- Excellent reading of the underlying fundamentals. Very good long-term and short-term projections as well. The only drawback of the analysis was that it lacked sufficient target levels. As can be seen, the price did not reach the Fibonacci support at 0.93202. The suggestion of interim support levels could have maximised the profits generated by the trade. Traders need to be aware of both the major and minor support and resistance levels in the market.
Disclaimer: Your capital is at risk! Trading and investing on the financial markets carries a significant risk of loss. Each material, shown on this website, is provided for educational purposes only. A perfect, 100% accurate method of analysis does not exist. If you make a decision to trade or invest, based on the information from this website, you will be doing it at your own risk. Under no circumstances is Trendsharks responsible for any capital losses or damages you might suffer, while using the company’s products and services. For more information read our Terms & Conditions and Risk Disclaimer.


