Today is the beginning of the first trading week of February, and it is going to be marked by important events taking place in the US and New Zealand. Arguably, the most important economic releases that are scheduled to take place this week are the employment survey in New Zealand and the NFP (jobs report) in the US, which is commonly revised each first Friday of every month. The recorded changes in the two countries’ labour markets would likely affect the NZDUSD currency pair, which has recently reached a major dip. Therefore, the purpose of this analysis is to examine the current technical outlook on the currency pair’s price action in the context of the changes to the overall trading volume, which are expected to occur due to several fundamental events taking place this week.
1. Long-Term Outlook:
As can be seen from the image below, the NZDUSD was at the lower end of a major bearish trend in early October 2019. The assertion is backed up by Elliott Wave Theory, as indicated by the numbers 1 through 5 on the chart, representing the dips and tops in the aforementioned trend. The theory posits that each cycle is comprised of the familiar 5-3 wave pattern, which means that currently, the NZDUSD is in the process of establishing the ABC correction of the initial 1-5 downtrend. Even more specifically, the pair is in the process of developing the AB and subsequently the BC swings - the first is a correction, and the latter is an impulse in the ABC pattern. Thus, once the price reaches a new dip, which would be the end of the minor correction ending at B, the price would then likely surge in a bid to finalise the second impulse of the ABC corrective pattern at C.
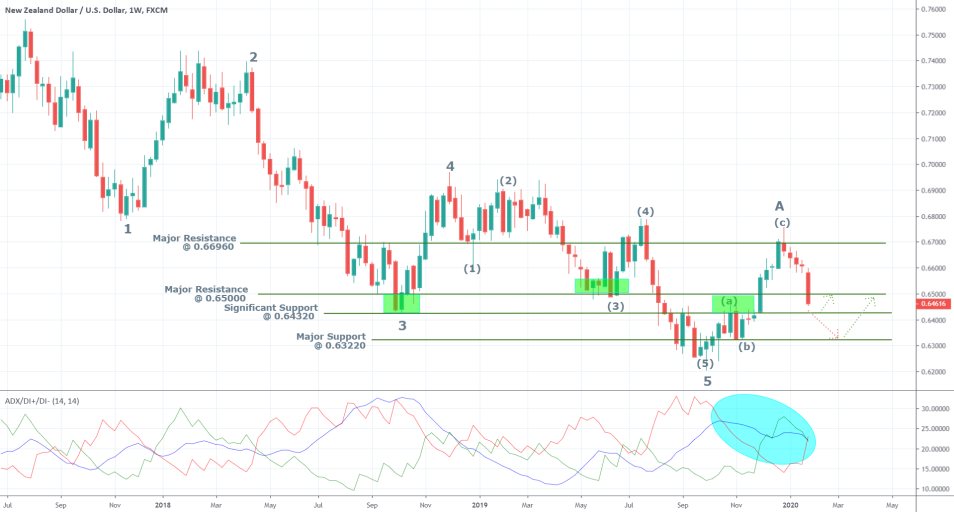
Last week the price managed to break down below the major resistance level at 0.65000 and is currently heading towards the significant support level at 0.64320. The downswing is a manifestation of the currently rising bearish sentiment's strength, and it has caused the ADX to lose steam. Presently the Average Directional Index is threading below the 25 value, which is indicative of the weakening strength of the previous trend and the increasingly more noticeable range environment. The establishment of a new range environment on the weekly chart is something to be expected as an outcome of the ABC correction.
2. Unemployment in the Two Countries:
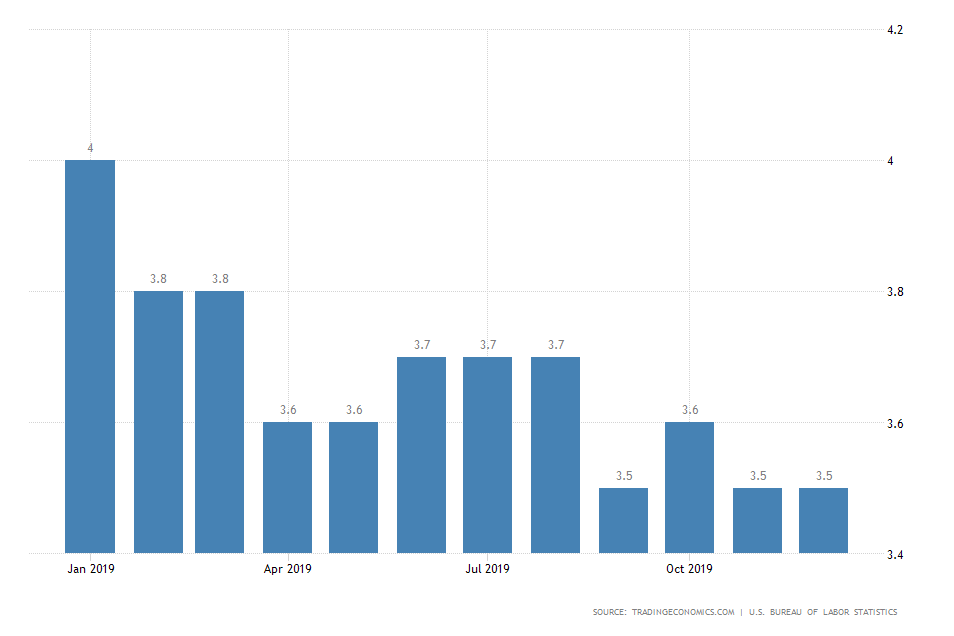
- In the US. The US labour market performed exceptionally well last year, with overall unemployment falling to as low as 3.5 per cent, which is the lowest level on record since 1969. Moreover, no indications are pointing to a likely termination of this trend, and the unemployment rate is anticipated to remain unchanged when the jobs report is released this Friday.
Despite the robust jobs gains, however, there is one point of concern – average earnings growth. One reason for the fragility of the US economy is the spare capacity in consumer spending. Even though the number of employed persons is at record-breaking levels, people are not spending as much as they could be. If this trend were to change the price stability would be increased, which would be welcoming news for the overall economy.
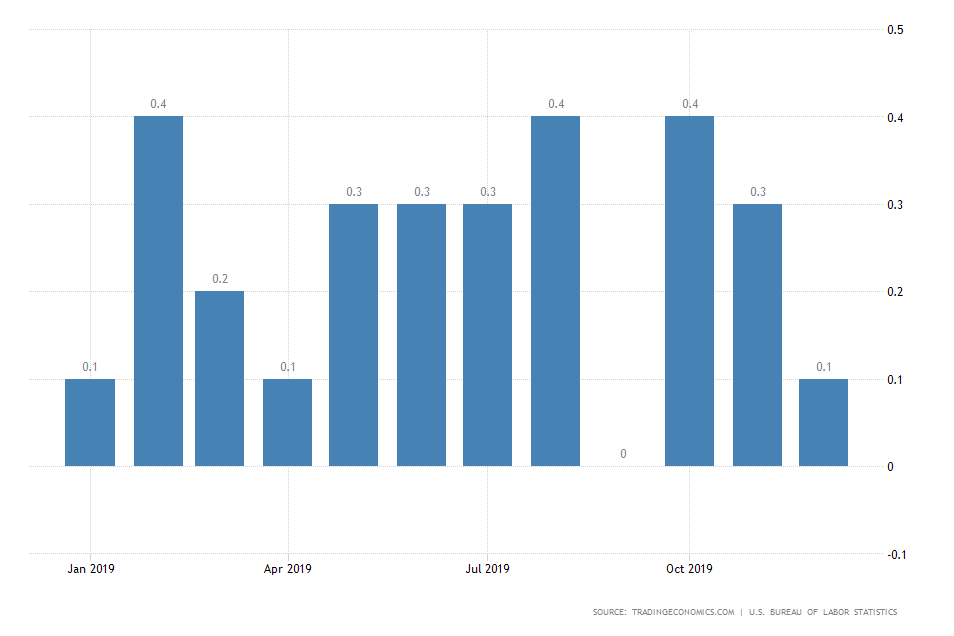
Therefore, the highlight of Friday’s report would be the recorded percentage growth in Average Hourly Earnings. In December the index grew marginally only by 0.1 percentage point, thereby missing the initial forecasts and causing a short-term selloff in all US-pairs. The consensus forecasts for the recorded performance in January project an increase of 0.3 per cent. If the data misses these expectations for the second consecutive time, the USD is more than likely to take a hit. Consequently, the NZDUSD pair is going to be affected positively by such turn of events, likely prompting the beginning of the final BC impulse of the ABC correction. Conversely, if the expectations are met or exceeded, the dollar would likely be strengthened by the news and thereby extend the length of the first AB impulse of the ABC correction.
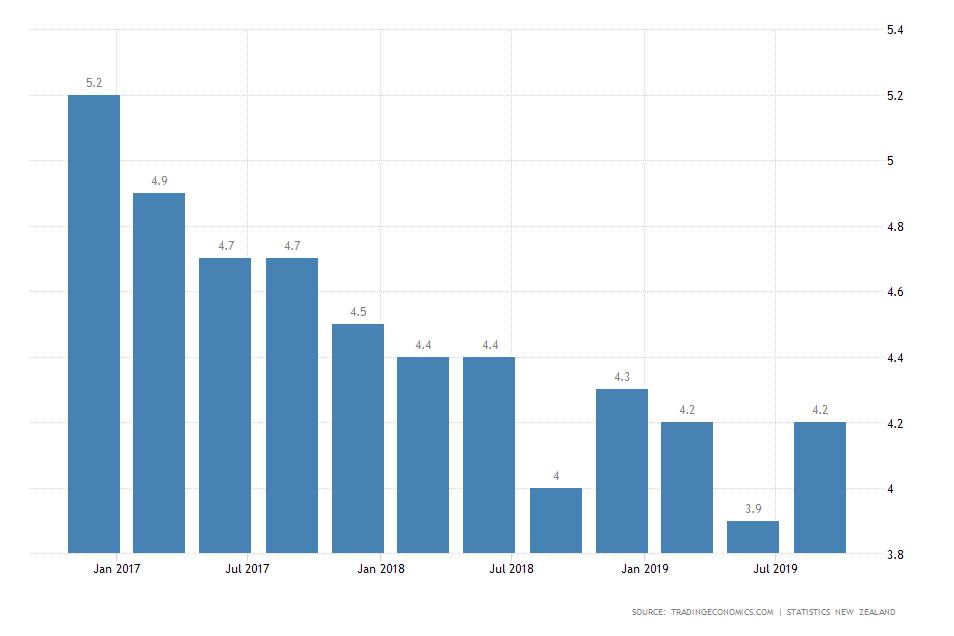
- In New Zealand. The labour market situation in New Zealand is somewhat reminiscent of that in the US. Employment growth is quite robust, and the overall unemployment rate, which is currently at 4.2 per cent, is close to another historic low. The consensus forecasts project no likely changes to the rate, which is anticipated to remain at its current 4.2 per cent level.
There could be, however, more detrimental consequences for the local labour market, stemming from the spread of the deadly coronavirus and its toll on the Chinese economy. The resilience of the New Zealand economy is closely dependent on the well-being of the global supply network, which is currently being curbed by the restrictions that are imposed by Governments in a bid to deter the spread of the virus. Limitations on travel in China are already hurting the local industry, as indicated by today's 9 per cent plunge in Chinese stocks. Thus, if the current panicky situation is prolonged in the future, there could be a cascade of negative consequences for the New Zealand economy, likely prompting a selloff of the NZD as a result.
3. Short-Term Outlook:
Meanwhile, the NZDUSD continues trading lower, and currently, the most pressing question remains to be where the correction would find support before the price establishes the final BC impulse?
It seems that the aforementioned significant support level is the most likely contender for that; however, there are additional reasons to believe that the price might fall even lower before it reverts itself. The next pivotal support level that needs to be considered is the major support at 0.63220. Consider the following chart:
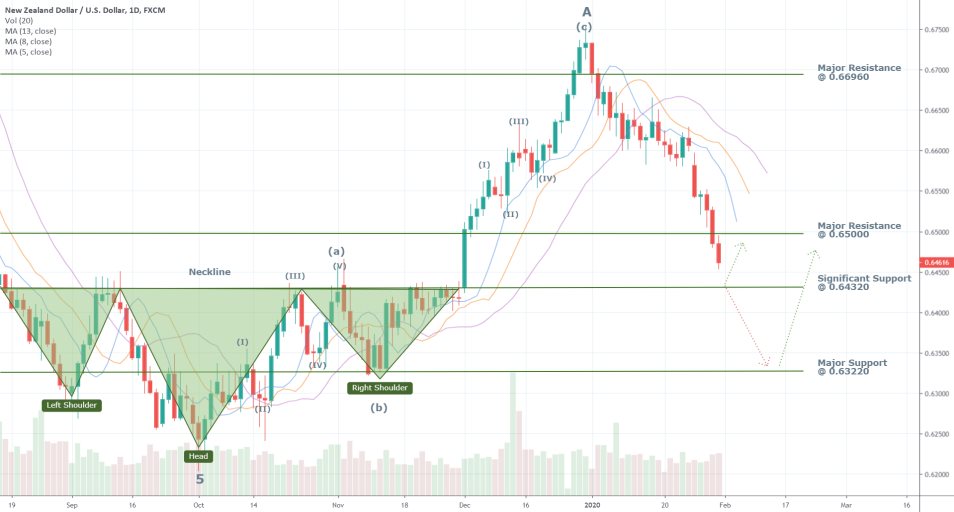
The daily chart above illustrates several aspects of the price action that are of crucial importance. First of all, there is an inverted Head and Shoulders pattern at the lower end of 5 (the end of the previously outlined Elliott Wave Pattern). The inverted head and shoulders pattern is typically taken to represent the termination of a bearish trend, which is in line with our previous attestations regarding the likely formation of a new ABC bullish correction. What is even more important, is the fact that the neckline of the inverted HAS pattern corresponds with the significant support at 0.64320, thereby giving it even more prominence.
Given those observations, it would be quite reasonable to anticipate a reversal of the price's direction around the significant support; however, it also stands to reason to prepare for a possible continuation of the current bearish swing even lower. If the price breaks below 0.64320, the next likely support level would be at 0.63220. This is the same level where the two shoulders of the inverted HAS pattern formed their own dips, which gives prominence of the support. The NZDUSD could fall to 0.63220 by the end of the week if the NFP report in the US exceeds the initial expectations and the employment data in New Zealand disappoints. In order to discern where the anticipated dip at B is the most likely to occur, the strength of the current short-term downswing needs to be evaluated at a lower timeframe. Consider the following chart:
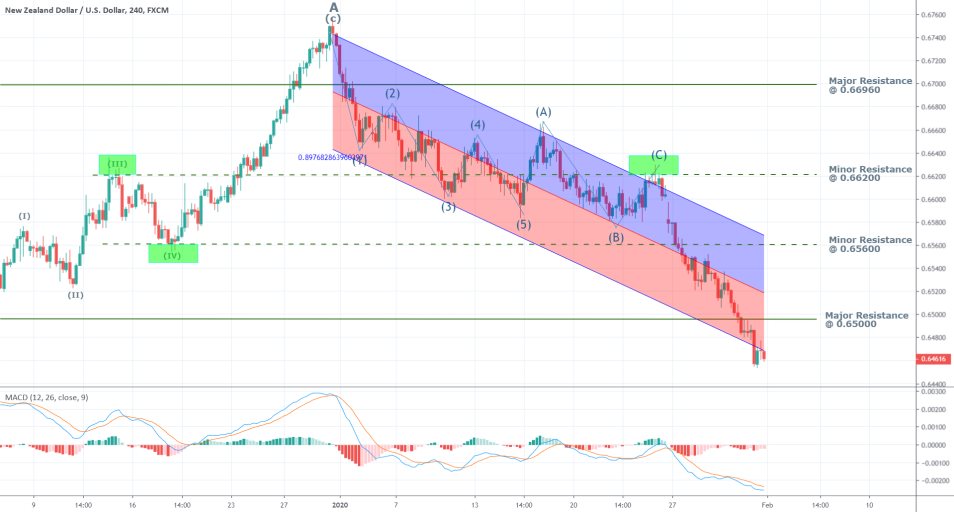
The NZDUSD is currently attempting to break down below the descending channel's lower boundary, which would increase the chances of the price eventually reaching the major support at 0.63220. If this turns out to be a false breakdown, however, and the price reverts back within the boundaries of the channel, the significant support at 0.64320 would again seem like the more probable turning point in the overall ABC correction.
The MACD has been threading in negative territory for quite a while now, and even though the convergence continues to be manifesting the existence of bearish sentiment (the EMA is lower than the MA), the stochastic chart is illustrating the waning strength of the bearish momentum. This can potentially allude to the early stages of the formation of a new bullish swing. However, it could also signify a momentary break in the establishment of the currently existing bearish downswing.
4. Conclusion:
In conclusion, most indicators and signals point to the likely formation of a bullish correction in the short-term – the aforementioned ABC pattern. A portion of this correction has already been established in that the top at A is clearly discernible on the chart. Therefore, it can be asserted that the price action is currently in the process of establishing the retracement leg AB (it is retracing from the correction’s general bullish direction). Once B is set, the price would subsequently head back north.
Two likely price levels have been advanced in today’s analysis on which B could form – the significant support at 0.64320 and the major support at 0.63220. The price is likely to rebound from either of them, depending on the outcome of the fundamental events that are scheduled for release this week. At any rate, the anticipated dip –B – should occur above the lowest point of the inverted HAS pattern (0.62040). The lowest point is the dip that formed at the pattern’s head – also the final impulse of the aforementioned 1-5 waves at 5 (see weekly chart).
Depending on the position of the turning point – where B is eventually formed – the price would likely swing upwards if the market conditions do not change drastically until then. If B forms around the significant support at 0.64320, then the closest target-level for the establishment of C would be the 0.65000 price level. Conversely, if B is formed near the major support at 0.63220, then C can form close to the significant support (then it would be resistance) at 0.64320.
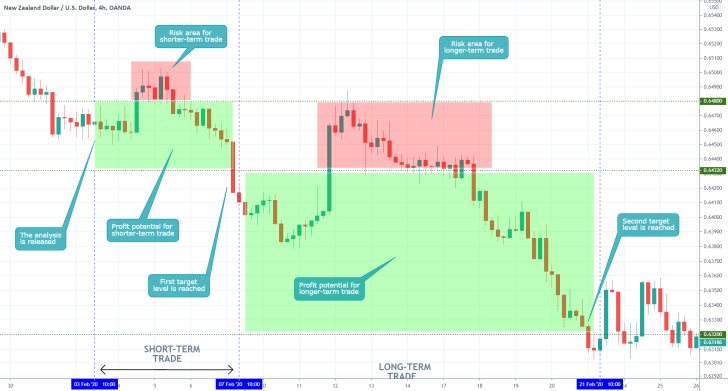
- The trade fulfilled the shorter-term expectations, however, the underlying market sentiment changed by the time the trade was closed, which rendered the secondary proposition unusable. The entry was solid - around the swing high of the interim bullish correction in an otherwise bearish trend.
Disclaimer: Your capital is at risk! Trading and investing on the financial markets carries a significant risk of loss. Each material, shown on this website, is provided for educational purposes only. A perfect, 100% accurate method of analysis does not exist. If you make a decision to trade or invest, based on the information from this website, you will be doing it at your own risk. Under no circumstances is Trendsharks responsible for any capital losses or damages you might suffer, while using the company’s products and services. For more information read our Terms & Conditions and Risk Disclaimer.


