Amazon – one of the biggest retailers in the world – remains an essential company for the tremendous effort in the US and elsewhere in curtailing the spread of the novel coronavirus. The continuation of goods delivery to households globally would safeguard the otherwise fragile supply chains amidst national lockdowns worldwide. In other words, Amazon becomes even more important at times when individuals are encouraged, and indeed forced, to stay at home.
Similarly to the shop assistants at supermarkets, big online retailers need to remain operational in order to satisfy the consumer demand of people stuck at home. This is especially true now when the daily lives of millions of people worldwide have been changed due to the coronavirus crisis. But what happens if and when the retailers themselves get infected with the virus?
On a corporate level, Amazon is going to benefit both directly and indirectly from the relief package that the US government has announced for the struggling American economy. The company’s stock, being part of the S&P 500, has already jumped on the government’s pledge to accommodate the stricken private sector. In addition to that, the direct credit that is being extended to individuals and families is anticipated to support increased customer spending, which, under the current circumstances, is likely to benefit the online retailers' market greatly.
We estimate that Amazon is one of those publically traded companies that are most likely to undergo through profound changes in its operations by the time the COVID-19 outbreak is dealt with. That is why its stock value is also expected to change drastically over the following weeks and months. Hence, the purpose of the current analysis is to evaluate the present fundamental factors, which are affecting the company, and to project the most likely future development of Amazon's price action in the following days and weeks.
1. Long Term Outlook:
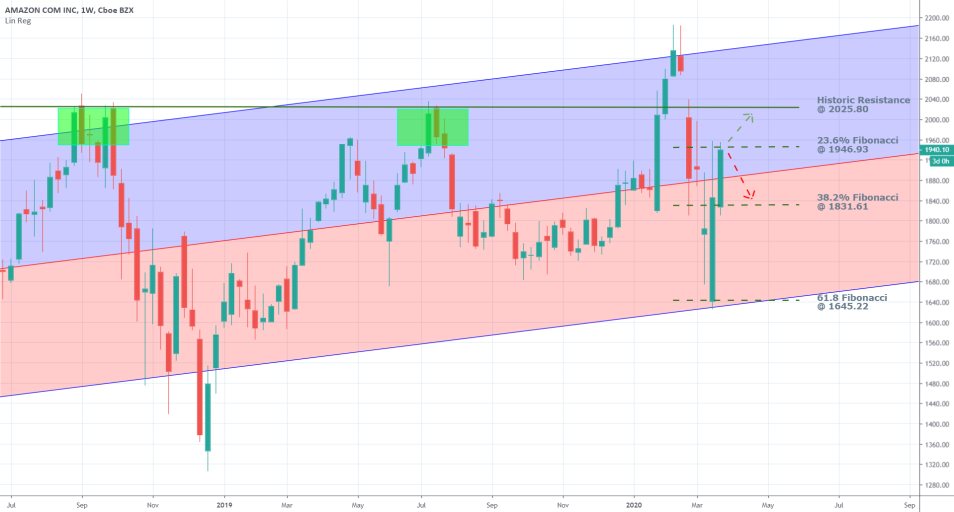
The first thing that can be deduced from the weekly chart below is that the price action rebounded from the ascending channel’s lower boundary last week. The jump of more than 6.50 per cent in the share price since then came after FED’s announcement for more liquidity that is to be injected into the economy, and the aforementioned promise of the US Senate for increased government spending.
The share price rebounded from the channel's lower edge, but it also found strong support from the 61.8 per cent Fibonacci retracement level at 1645.22, which coincided with the channel's lower boundary. This behaviour of the price action is critical because it demonstrates the quite robust buying pressure around the last significant Fibonacci support.
If the price had managed to break down below 1645.22, the next prominent support could have been found around the level of the previous dip – around 1300. Instead, the market is demonstrating quite strong bullish sentiment around the 61.8 per cent Fibonacci, which makes future breakdowns below set level seem highly unlikely at present.

For the time being, the share price remains stuck trading in a narrow range of crucial importance for its future development. That is so because a potential breakout or breakdown outside of the range’s boundaries is going to manifest the most likely future behaviour of the price action for the next several weeks.
The lower boundary of that range is represented by the 38.2 per cent Fibonacci retracement level at 1831.61, which is where this week's price action opened. The 23.6 per cent Fibonacci retracement represents the upper boundary of the range at 1946.93. As can be seen, the price has already attempted to break out above it this week but failed to do so.
The importance of the range is further boosted by the fact that the ascending channel's middle boundary cuts right through it. Hence, the price action's consolidation around that middle line is going to shed more light on the current momentum in the market. If Amazon's share price finishes this week above the middle line, this would mean that the market bulls have slight prevalence over the bears. The opposite would be true if the share price closes the week's session below the middle line.
If the underlying price manages to break out above the range's upper boundary, then the next primary target would once again be the historic resistance at 2025.80. Conversely, if Amazon's stock breaks down below the range's lower boundary, then the next target for the renewed bearish swing would be the 38.2 per cent Fibonacci retracement and the support level there at 1831.61.
2. Unprecedented Demand Amidst National Lockdowns:
While most industries are being temporarily closed down internationally, the online retail sector is experiencing surges in demand as more and more people are now isolating themselves at home. This, in turn, is likely to be reflected positively in Amazon's next earnings statement, owing to the fact that many people now rely on deliveries of essential goods to their doors for safety measures.
In a recent statement from Amazon, the company announced that it would be hiring over 100 000 new workers across the US, to satisfy the labour needs that are ‘unprecedented for this time of year.
“As the COVID-19 pandemic continues, Amazon and our network of partners are helping communities around the world in a way that very few can—delivering critical supplies directly to the doorsteps of people who need them.[…] We are opening 100,000 new full and part-time positions across the US in our fulfillment centers and delivery network to meet the surge in demand from people relying on Amazon’s service during this stressful time, particularly those most vulnerable to being out in public.”
All of this is likely to benefit the share price of Amazon in the midterm, as more deliveries now are going to be reflected on the earnings statements for Q2 and Q3. Thus, Amazon's stock can reach pre-crash levels as its operations are currently being boosted.
3. Short Term Outlook:
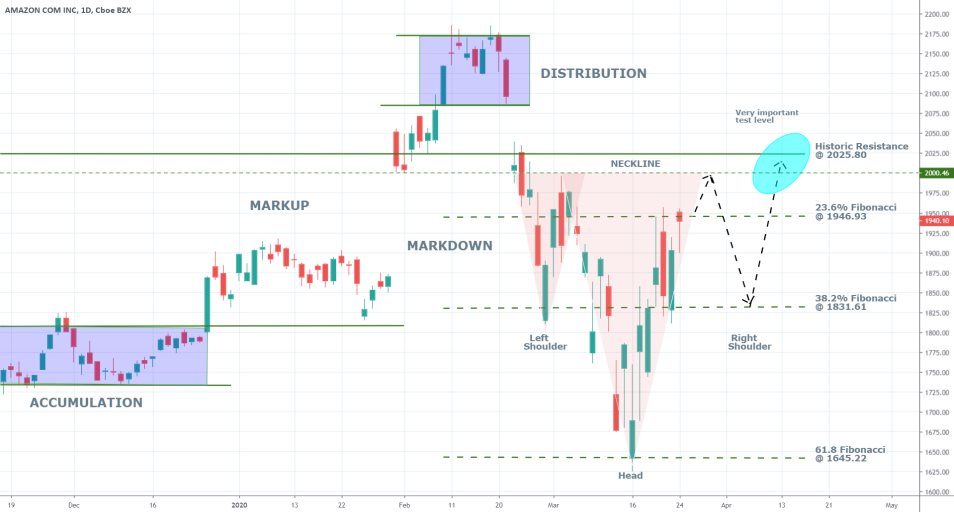
As can be seen on the daily chart below, the price action has developed while displaying characteristics that are typical of the Wyckoff cycle. It is currently in the process of correcting the losses from the last Markdown.

The price action appears to be in the process of developing an Inverted Head and Shoulders pattern, which is commonly found at the end of bearish trends. It is a trend reversal pattern, which signifies the likely formation of a new bullish upswing.
It is interesting to note that the left inverted shoulder reached a dip at the 38.2 per cent Fibonacci retracement, whereas the inverted head of the pattern reached a dip at the 61.8 per cent Fibonacci. This behaviour demonstrates robust support at these crucial levels and favours the build-up of bullish sentiment in the market.
If the development of the pattern is to be continued, then the price can be anticipated to tumble to the 38.2 per cent Fibonacci retracement level at 1831.61 once again, before the price finds the necessary support and the market can begin establishing a new bullish trend.
After the Inverted Head Shoulder pattern is completed (if the market proceeds with its development), the market would have to break out above two crucial levels before the potential new bullish sentiment can be wholly confirmed. The more obvious one is the historic resistance at 2025.80. If the price manages to break out above it, then the market would become prevailingly bullish once again.
The other significant obstacle in the way of a potential new upswing's development is the inverted head and shoulders' neckline at 2000.00. This level is essential for two reasons. Firstly, as a neckline of the pattern, it represents a natural resistance level. Secondly, it has considerable psychological importance due to the many zeroes in the number. Such levels are typically serving as turning points for the direction of the underlying price action. Hence, market bulls should be cautious if they consider entering long before the price action breaks out above those two levels.

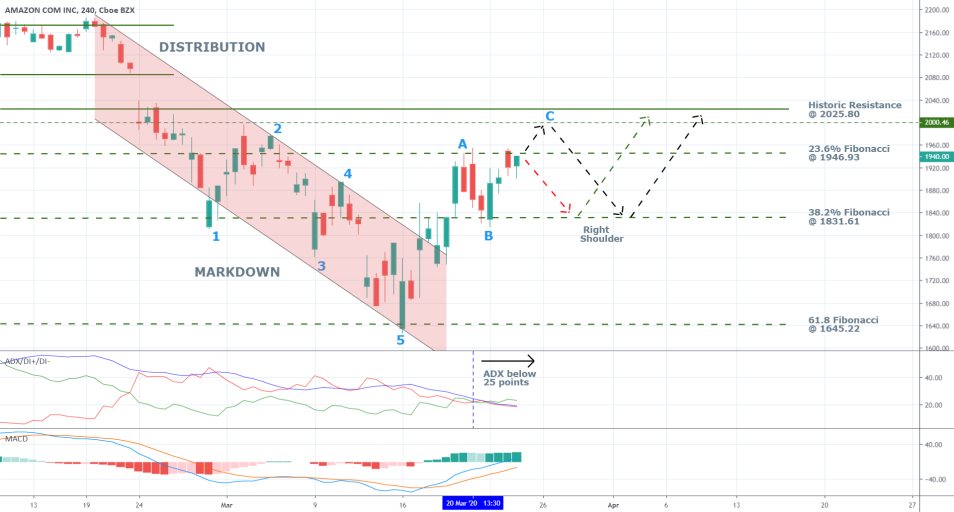
The ADX on the 4H chart above is currently threading below 25 index points, which is illustrative of a waning trading environment. Such behaviour is to be expected as a trend reversal pattern unfolds. The now subdued strength of the recently bearish trend is a necessary condition for the further development of the inverted head and shoulders pattern and a likely subsequent establishment of a new markup.
Elliott Wave Theory can be utilised to confirm the termination of the last Markdown, which reached a dip at the 61.8 per cent Fibonacci retracement (the head of the inverted H&S pattern). The subsequent ABC correction, which is still unfolding, is expected to reach a peak at around the psychologically important 2000 price level. Then, the right shoulder of the inverted H&S pattern should begin developing. It is likely to reach a dip around the 38.2 per cent Fibonacci before a new Markup can begin advancing north.
The rising bullish momentum in the short term, as represented by the MACD, supports the expectations for the further development of the bullish ABC correction.
4. Concluding Remarks:
Both the technical and the fundamental factors seem to suggest the likely future surge in Amazon’s share price over the midterm. However, there are reasons to anticipate a minor bearish correction to take place beforehand.
These projections could change suddenly as the coronavirus situation continues to evolve.

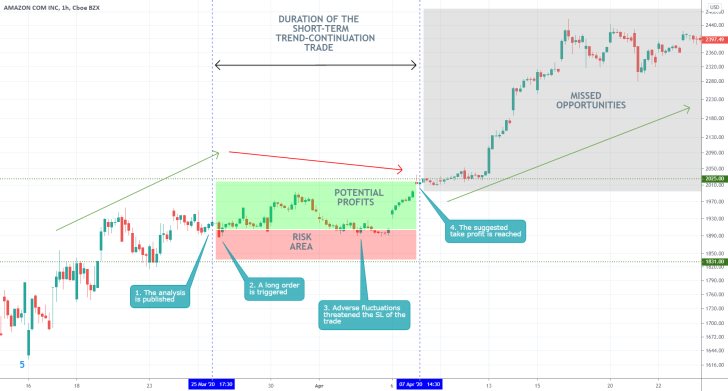
- The analysis was quite successful in determining the short-term outlook of the market, however, its longer-term projections were completely mistaken. Amazon's shares did not correct to 1831.00 after reaching 2025.00, but instead the bullish trend was resumed. This discrepancy resulted from a failure to understand the significance of the underlying fundamentals driving the market at that time, that were listed in the analysis itself. It is especially damming for traders to exit out of the market prematurely after having gained favourable entry into an existing trend beforehand. To avoid making such mistakes, traders need to have the mental stamina to watch the trend develop steadily for days and weeks at a time.
Disclaimer: Your capital is at risk! Trading and investing on the financial markets carries a significant risk of loss. Each material, shown on this website, is provided for educational purposes only. A perfect, 100% accurate method of analysis does not exist. If you make a decision to trade or invest, based on the information from this website, you will be doing it at your own risk. Under no circumstances is Trendsharks responsible for any capital losses or damages you might suffer, while using the company’s products and services. For more information read our Terms & Conditions and Risk Disclaimer.


