The release of Alibaba Group Holding Ltd.’s quarterly earnings report, which is taking place later today before the market open in the US, is the latest such report set for release during the current earnings season. It should be mentioned therefore that this analysis is compiled prior to the publication of Alibaba’s recorded performance in the quarter ending December 2019, which means that it will examine the preliminary situation of the company and evaluate the likely future development of the price action after the release.
The earnings season for Q4 2019 has so far been marked by the excellent performance of companies in the tech industry, such as Apple; Microsoft; Tesla and others. This outstanding performance is what has been driving the stock market north for the past few weeks; however, notable gains in the retail sector should also be acknowledged. Amazon delivered better-than-expected EPS data as well, which is why its share price has rallied by more than 15 per cent since the report’s release. Amazon’s robust performance is the primary incentive for traders and investors’ heightened optimism ahead of Alibaba’s release, as the latter is frequently compared to the former. Additionally, the retail sector is enjoying very advantageous conditions, such as bolstered consumers’ sentiment, which presupposes robust gains for Alibaba as well. On the other hand, however, the continually spreading coronavirus in China, especially in the Wuhan province, raises fears in the country that the national economy could suffer dramatically due to curbed spending. That is why this analysis would also estimate the likely long-term ramifications for Alibaba that could stem from the outbreak of the epidemic.
1. Long-Term Outlook:
The overall outlook on Alibaba’s share price in the long term is mostly bullish, as can be seen on the weekly chart below. The company has managed to report better-than-expected earnings data in its last four quarterly reports, which has resulted in the creation of a major bullish trend. Using the Average Directional Index (ADX), it can be discerned that the trend had become very solid in early January 2020, since that is when the ADX surpassed the crucial 25 index points mark.
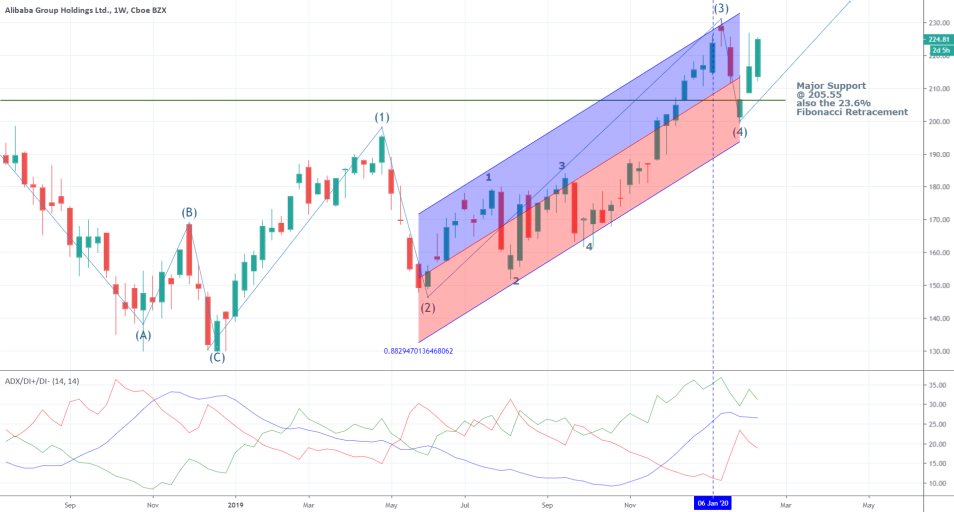
Additionally, Elliott Wave Theory can also be utilised to frame the behaviour of the bullish trend and also to catalogue its distinct stages. Consequently, it can be seen that the price has recently (three weeks ago) concluded developing the second pullback in the 1-5 Elliott wave pattern – the dip at (4). The price has immediately changed directions there and resumed trading above the major support level at 205.55. Two crucial things need to be considered here.
First of all, the dip at (4) is placed higher than the top at (1), which is a sign of strong bullish sentiment in the market. This is why so many long orders had been opened at the dip at (4) based on this expectation for a trend continuation. Second of all, the aforementioned support level prevented the price action from continuing to go south of 205.55, which is yet another strong indication that the major bullish trend is likely to persist. This support level is so important because it is also the 23.6 per cent Fibonacci Retracement of that same bullish trend, which provided yet another incentive for the bulls to place long trade orders around the 205.55 level. All things considered, the price action is likely to surpass the top at (3) and continue going north, provided that the earnings report for Q4 2019 is sufficiently positive.
2. The Coronavirus and Alibaba’s Annually Active Consumers:
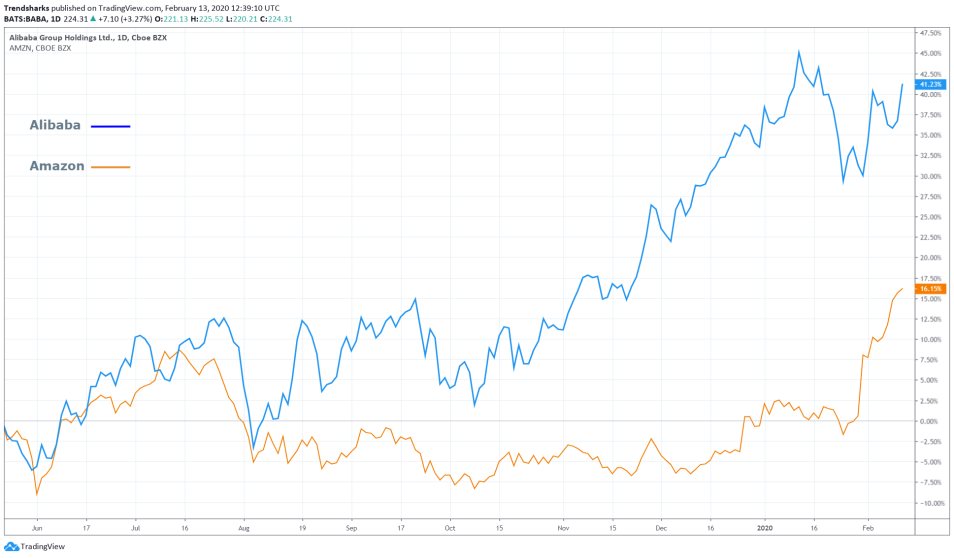
Three major factors deserve consideration under the rules of the fundamental analysis. First of all, it would be advantageous to understand the condition of the retail industry at the current time. As it was already mentioned, Amazon was able to outperform the consensus forecasts, and subsequently, its share price soared. This is evidence of the aforementioned solid conditions for growth that are currently benefitting the retail industry. Therefore, the same conditions are likely to bolster Alibaba’s earnings performance as well. Additionally, owing to the fact that Alibaba’s shares have been able to outperform Amazon’s for the better part of 2019 as can be seen on the chart below (Alibaba is in blue and Amazon in orange), it would be fair to expect this trend would continue. That is why many market experts anticipate yet another solid performance by Alibaba to be reported for the fifth consecutive time later today, which would likely have a positive impact on the company’s share price.
Second of all, a major determinant of the ultimate success of today’s report would be one key metric in Alibaba’s earnings statement – annual active consumers. As Matthew Johnston puts it :
“When Alibaba reports its latest earnings on the 13th of February, 2020 for Q3 2020 fiscal year, investors will focus on a key metric, "annual active consumers" across Alibaba's online properties. Analysts currently estimate active consumers will rise year-over-year (YOY), along with earnings and revenue.”
Alibaba is expected to report $1.87 Earnings Per Share, which would be the company's best performance yet if it is met later today. In comparison, the retail giant reported EPS of $1.39 for the same period a year prior. Thus far, the most solid EPS of $1.49 were reported in Q3 of 2019.
Third of all, external factors could potentially impede Alibaba's long-term growth, even if the anticipations for solid earnings are realised later today. The Chinese government has attempted to curb the spread of the novel coronavirus by imposing restrictions on travel in China, especially in the Wuhan province, which was ground zero for the virus' outbreak. Because of the tight grip on travel and the momentary suspension of production in multiple facilities in the country, it is speculated that aggregate demand would fall considerably in this first fiscal quarter of 2020. Subsequently, muted consumer demand caused by the rising fears of the virus's spread is most likely to impede the retail industry in China, which, in turn, would undoubtedly hit its flagship – Alibaba. Such a gloomy scenario still hasn't begun to affect the Chinese retail industry negatively in any noticeable way; however, investors should remain cautious of the potential long-term ramifications for Alibaba if the situation continues to worsen.
3. Short-Term Outlook:
The daily price chart of Alibaba's share price below demonstrates the regression channel that was used on the weekly chart as well to catalogue the development of the major bullish trend. It can be seen that after the price reached the dip at (4), it almost immediately bounced back above the channel's middle line, which is evidence of strong support and confirms the strength of the bullish trend.
Elliott Wave Theory can be used once again in order to categorise the distinct impulses and pullbacks that comprise the waves of the superior 1-5 Elliott Wave Pattern (presented on the weekly chart). Thus, it can be seen that the (3)-(4) pullback is comprised of a corrective ABC pattern. Additionally, it can be seen that the anticipated (4)-(5) major impulse on the weekly chart has already started to develop its own 1-5 Elliott Pattern. The price action has produced the top at 1 (at 226.50) as well as the dip at 2 (the pullback), which has reached 213.50 and found strong support there at the regression channel's middle line. All of this confirms the previous argument that projects the formation of a new major impulse that is due to take place soon, which happens to be before the release of today’s earnings report.
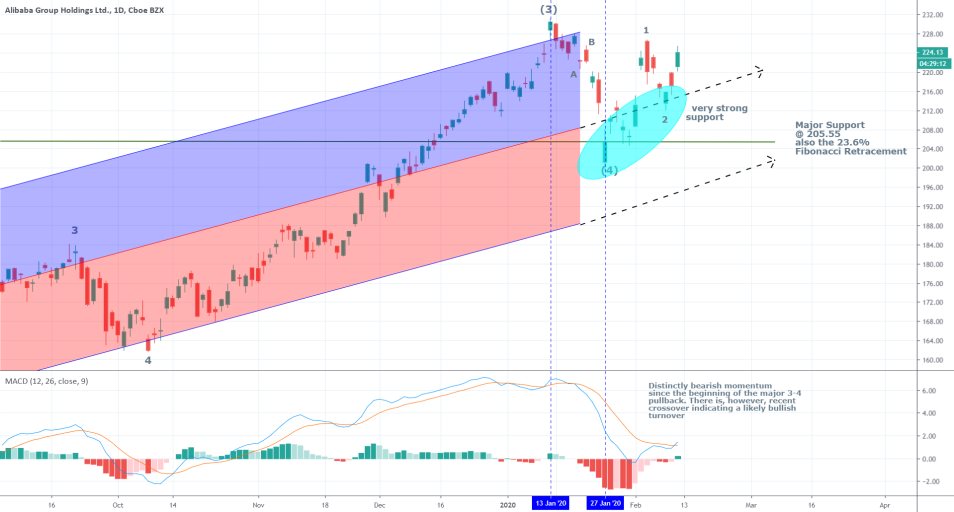
Another major evidence in support of the bullish sentiment in the market is the MACD (remember that the ADX confirmed the trending environment on the weekly chart, which is why the MACD is applicable in the current case). Even though the indicator suggests the existence of bearish momentum between the 13th of January and the 27th of January, the price was not falling at that time, which could indicate that the bears did not seize the opportunity to start executing short orders at that time actively. Moreover, it could indicate that the market is simply awaiting the continuation of the major bullish trend's development, whereas the bearish commitment is mostly non-existent.
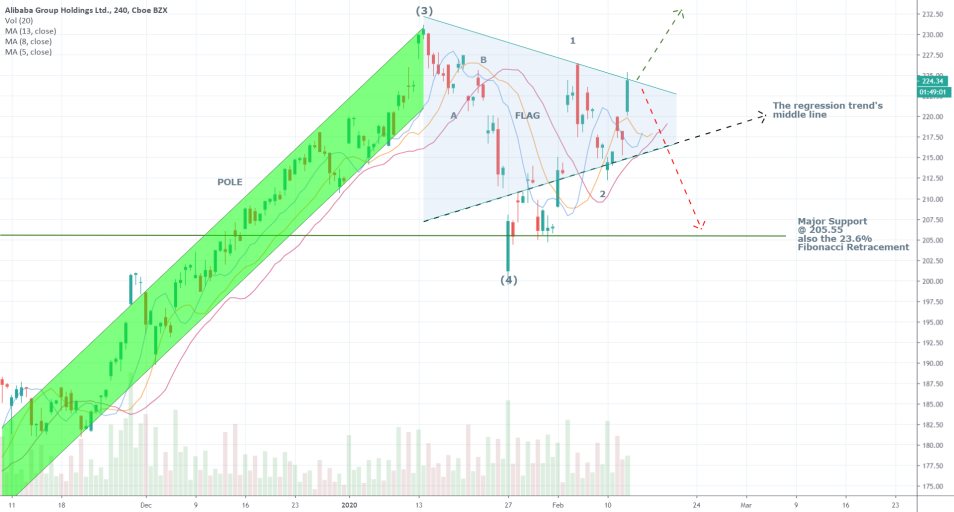
On the 4H chart below can be seen that the price action has formed a bullish flag structure, which is a pattern that typically indicates trend continuation. The flag itself is becoming increasingly narrower, which could mean the formation of a subsequent break out (the bottleneck effect). The flag's lower trend line coincides with the aforementioned regression channel’s middle line, which also confirms the bullish sentiment.
The three moving averages (the 5-day; 8-day and 13-day) are also starting to position themselves in an ascending order, which, supports the expectation for the continuation of the bullish trend.
4. Concluding Remarks:
If there is a general surprise in the market after the release of Alibaba’s earnings report later today, meaning worse-than-expected performance, the price is likely to break down below the regression channel’s middle line and head lower. In this case, the first major support level that is going to be tested would be the 23.6 per cent Fibonacci retracement at 205.55. At the current rate, the likely continuation of such a bearish downswing south of this support level can only be supported by fears of the coronavirus’s spread. Therefore, even if the earnings report turns out to be negative and there is some initial shock, the price is unlikely to continue falling in the long-term unless there are some substantial external factors present, weighing down on the price action.
Conversely, if the observed earnings data in the quarterly report meets the consensus forecasts, the resulting market excitement is likely to continue developing the previous bullish channel, and propel the price action above (3). In this case, the coronavirus’s outbreak could potentially curb the development of the major (4) – (5) impulse wave in the long term. As regards the earnings report itself, apart from the EPS data, the most important metric to watch for will be the annual active consumers, as stated above.
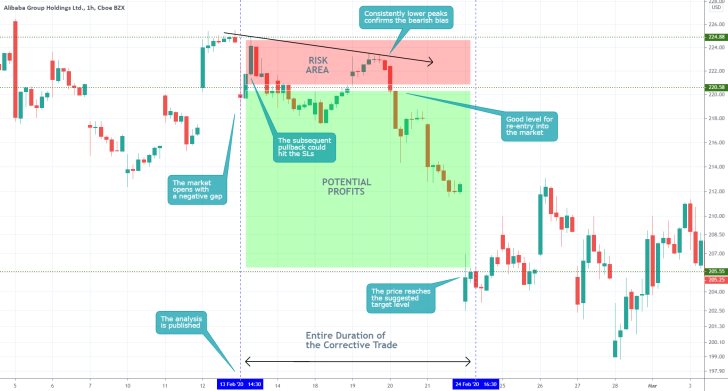
- The price action did fall after the release of Alibaba's earnings report, as per the expectations of the analysis. The market opened with a massive gap, which made entering into the market at that time particularly unfavourable. The subsequent retracement could have triggered any stop losses placed in the risk area. What needs to be remembered here is that one should not rush to enter the market after an important event, even if the price had already moved in his or hers anticipated direction. Because any subsequent pullbacks and retracements could hit the stop-losses of his positions with late entry. The price action went on to establish two corrective peaks after the release of the report. These lower peaks manifested the rising bearish bias at that time.
- Hence, even if the two retracements had hit the stop losses of any premature trades, there were a lot of opportunities for traders to place new positions at more preferable levels. The big takeaway here is that one big movement after a highly anticipated event such as an earnings report release does not necessarily mean that the trading opportunity is spent. Patient traders could always find favourable entry levels into a new trend during interim corrections. Also, sometimes several SLs of initial trades could be hit before the trader could manage to place a trade with excellent entry, and right before the next big price swing.
Disclaimer: Your capital is at risk! Trading and investing on the financial markets carries a significant risk of loss. Each material, shown on this website, is provided for educational purposes only. A perfect, 100% accurate method of analysis does not exist. If you make a decision to trade or invest, based on the information from this website, you will be doing it at your own risk. Under no circumstances is Trendsharks responsible for any capital losses or damages you might suffer, while using the company’s products and services. For more information read our Terms & Conditions and Risk Disclaimer.


