Ever since the FED decided to adopt a looser monetary policy in early-July, the previously struggling dollar received the necessary support from the FOMC to pause its freefall against other major currencies. The near-term surge in demand for the greenback is attributed to heightened investors' optimism. It stems from the more than likely survival of the US financial system due to the scaled-up asset-purchasing programs of the FED.
Yet, the actions of the FED alone cannot foster a prolonged strengthening of the dollar on their own, especially given the recent economic developments in the US. Chiefly, the looming prospects of deflation cast a shadow over the longer-term appreciation of the greenback.
As we demonstrated in our 'Weekly Expectations' material from today, both France and Germany are scheduled to release crucial data reflecting on the recorded industrial activity in the two countries in June. The consensus forecasts project robust performance, which is expected to bolster the strength of the euro in the short term.
The underlying fundamentals seem to suggest a likely change in the underlying market pressures currently affecting EURUSD's price action. In other words, the retracement from the broader bullish run could be exhausted soon, which would favour the continuation of the rally's development.
Hence, the purpose of today's analysis is to examine whether or not EURUSD's price action has reached a new swing low. If so, could this bottom be followed by renewed bullish rally?
1. Long-Term Outlook:
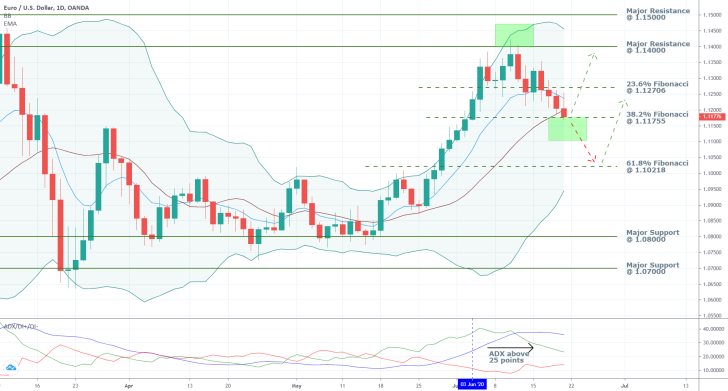
As can be seen on the daily chart below, EURUSD's price action rebounded from the major resistance level at 1.14000 several days ago, which marked the beginning for the establishment of the subsequent retracement. It reached the 38.2 per cent Fibonacci retracement level at 1.11755 last Friday, which represents a significant support, and a potential turning point for the underlying direction of the price action.

The expectations for a trend reversal around the current market price are substantiated by the aforementioned fundamentals coupled with the significance of the 38.2 per cent Fibonacci, as a prominent support level. Moreover, the latter is currently coinciding with the Bollinger Bands' middle line (in red), which also serves as an intermediate support.
The EURUSD is currently contained within the BBs' middle line and the 10-day EMA (in blue), which could prompt the price action to consolidate in a tight range between the two. Such a scenario would also mean the conclusion of the retracement's establishment; however, it seems less likely given the underlying strength of the prevailingly bullish market.
The ADX indicator has been threading above the 25-point benchmark since the 3rd of June, which means that the price action remains trending despite the retracement. This makes a potential rebound from the 38.2 per cent Fibonacci level seem highly likely. At any rate, the continuation of the bullish trend's development would remain the most likely scenario for as long as the ADX resumes threading above 25 points.
If the price action does rebound from the current support, the next target level for the renewed bullish trend would be the 23.6 per cent Fibonacci retracement at 1.12706, followed by the major resistance level at 1.14000. Conversely, if the price action manages to break down below the 38.2 per cent Fibonacci, in spite of the underlying fundamentals, the next target level for the newly developing Markdown would be the 61.8 per cent Fibonacci retracement level at 1.10218.
2. Short-Term Outlook:
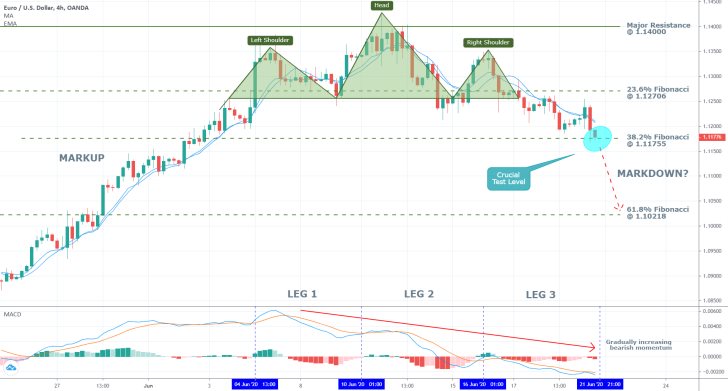
As can be seen from the 4H chart below, the retracement was commenced following the establishment of a 'Head and Shoulders' pattern. This formation represents a classic trend reversal indication, which is commonly found at the upper end of a recent bullish trend. A new downswing typically follows the emergence of a H&S pattern.

Such a downswing was indeed established and is currently nearing the aforementioned crucial test area - the convergence of the 38.2 per cent Fibonacci retracement level with the middle line of the BBs, as seen on the daily chart above.
Unless the price action manages to bounce back up swiftly in the immediate future, a breakdown below the 38.2 per cent Fibonacci would seem increasingly likelier. That is so because of the rising bearish momentum in the short term.
The behaviour of the MACD indicator supports the last assertion. The convergence/divergence has been steadily following since the beginning of leg 1, and the three waves are all downwards sloping. All of this favours the continuation of the downswing's development below the 38.2 per cent Fibonacci retracement level; however, the MACD has only recently broken below the 0.00 per cent level (leg 3) on the histogram. This means that it is not too late for the price action to rebound back north.
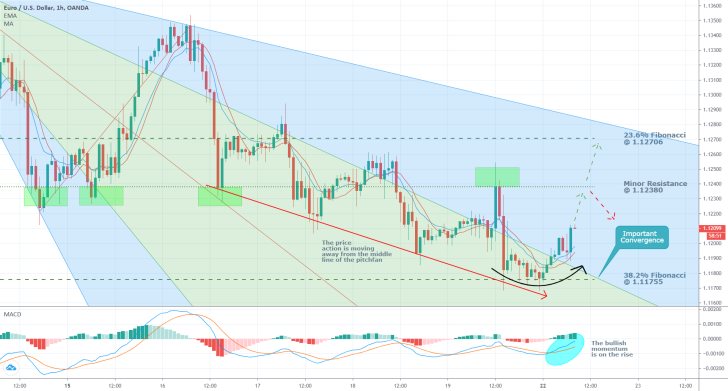
The anticipated rebound could have already commenced, as can be seen on the hourly chart below. So far, the support at the 38.2 per cent Fibonacci appears to hold, which could indicate that the expected swing low has already been established.
The price action has already started to head towards the minor resistance level at 1.12380, which is demonstrative of this bullish sentiment in the market. Moreover, the MACD has begun to surge in the very short term, which is also illustrative of increasing bullish momentum.
There are also more subtle indications of the market sentiment's transition towards becoming more bullishly oriented. As can be seen, the price action is moving away from the pitchfan's middle line, which is evocative of rising bullish commitment. The EURUSD has recently broken into the upper part of the pitchfan's body, which confirms those expectations.
Finally, the underlying bullish momentum is surging in the very short-term, as illustrated by the rising MACD.

3. Concluding Remarks:
When the aforementioned fundamentals are considered in conjunction with the price action's behaviour around the pivotal 38.2 per cent Fibonacci retracement level, the expectations for the emergence of a new upswing are substantiated.
However, the transition of the market from the retracement towards such a new upswing is likely to be marked by heightened volatility. Therefore, expect adverse price fluctuations to complement the advancement of the EURUSD further north.

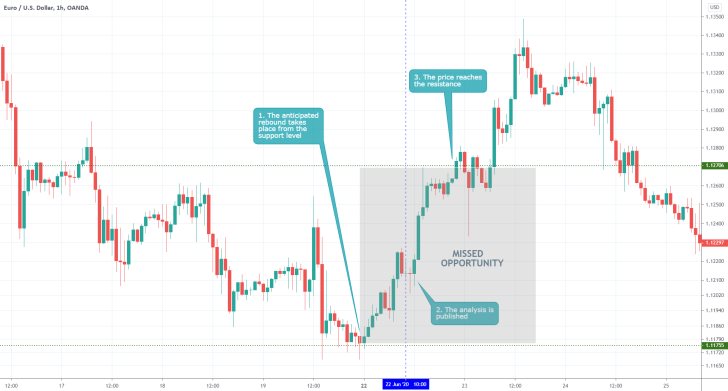
- The analysis was quite right in expecting a rebound from the 38.2 per cent Fibonacci retracement level, however, the opportunity was underutilised because of late publication. Even the best forecasts are worthless if they are released late. Opening a buying order after the publication would have been a mistake, because the adverse volatility could have wiped out the position.
Disclaimer: Your capital is at risk! Trading and investing on the financial markets carries a significant risk of loss. Each material, shown on this website, is provided for educational purposes only. A perfect, 100% accurate method of analysis does not exist. If you make a decision to trade or invest, based on the information from this website, you will be doing it at your own risk. Under no circumstances is Trendsharks responsible for any capital losses or damages you might suffer, while using the company’s products and services. For more information read our Terms & Conditions and Risk Disclaimer.


