The GBPUSD has been flexing muscles over the past several days as the pair recuperated from the last dip. The price action is currently establishing a new upswing, testing the upper boundary of a major Flag pattern. If it manages to break out higher, this could very likely confirm the strong bullish pressure in the market. Such a turn of events would also signify the potential continuation of the previous rally.
As regards the current fundamental factors, the underlying sentiment is mostly favouring the continuation of the current bullish upswing. Looking at the economic calendar for this week, the unemployment data in the UK tomorrow is likely to cause heightened volatility on the pound. But more importantly, the earnings season in the U.S. is likely to strengthen the weakened greenback, as major companies are expected to post solid earnings numbers for the first quarter of 2021.
Regardless, the prevailing market bias remains ostensibly bullish, which is why traders should not rush to sell right away. Quite the contrary, the GBPUSD is likely to attempt breaking even higher, which in itself entails interesting trading opportunities.
1. Long-Term Outlook:
As can be seen on the daily chart below, the GBPUSD is currently attempting to break out above the descending Flag's upper boundary. The Flag itself signifies a trend continuation pattern, which implies the persistence of bullish bias in the long term. In other words, a decisive breakout above the Flag at the present rate could allow the GBPUSD to once again target the psychologically significant resistance level at 1.40000 in the next several weeks.
The upper boundary of the Flag has already been tested on three separate occasions, whereas its lower boundary has been reached two times. If the price fails to close above the Flag, a likely bearish correction taking place afterwards could potentially attempt to reach the 23.6 per cent Fibonacci retracement level at 1.35765. The latter is currently situated in the middle of the Flag.
The 1.38000 level would play a crucial role in determining the next direction of the pair. It had previously served as a support level (the first test of the lower boundary of the Flag) before turning into a temporary resistance. If the price action manages to consolidate above it, this will allow the GBPUSD to secure its recent gains and prepare for climbing further north.
Notice that the latest upswing emerged after the price rebounded from the 100-day MA (in blue), which serves as a floating support. This factor substantiates the bullish expectations for continued price appreciation. It would take another attempt at the moving average to invalidate those expectations.
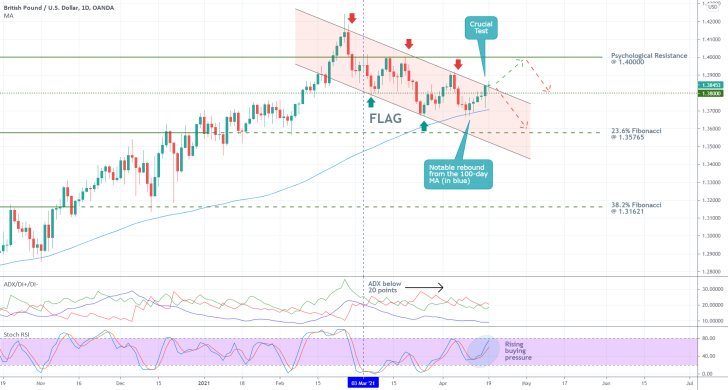
The ADX indicator has been threading below the 20-point mark - the 25-point benchmark is the one that separates trending environments from range-trading ones - since the 3rd of March. This confirms that the market is indeed ranging at present. This type of environment typically sets conditions that compel the underlying price action to fluctuate up and down. In other words, ranging environments tend to drive the price action in zig-zagging corrective motions.
The Stochastic RSI, in turn, is underpinning rising buying pressure. The indicator is yet to reach its overbought extreme, which means that the current upswing may continue to rise higher before bears manage to regain some control.
2. Short-Term Outlook:
More bullish confirmation can be observed on the 4H chart below. The price action has evidently established a Double Bottom pattern (the Left Bottom notably rebounded from the lower boundary of the Flag), which is commonly taken to signify bullish reversals. This development is inlined with the broader expectations.
The area in green - spanning between the 1.38000 support and the 1.38400 resistance - roughly outlines the Neckline of the Double Bottom pattern. What this means is that while pullbacks to 1.38000 are still possible, the price action is more likely to continue appreciating in the near future. This would be the case for as long as the GBPUSD remains concentrated above the Neckline.
More bullish confirmations can be derived from the fact that after establishing a false breakdown, the price action went on to close above the 200-day MA (in orange). If it manages to shoot above the 300-day MA (in purple), the underlying bullish pressure will become even more robust.
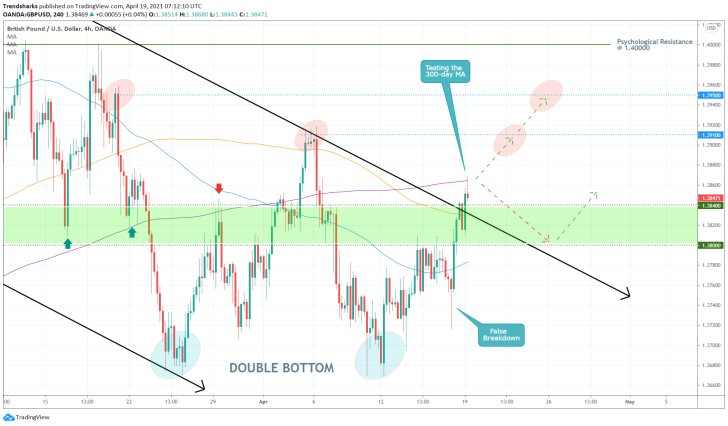
The first target for the bullish upswing is encompassed by the minor resistance level at 1.39100. The minor resistance at 1.39500 represents the second target. These two resistances serve as intermediate boundaries before the price action could attempt to rise to the psychological resistance at 1.40000.
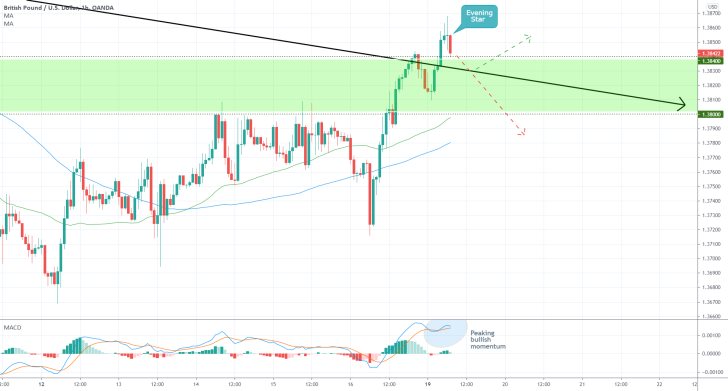
Looking at the hourly chart below, the price action appears to be forming an Evening Star pattern at the top of the latest upswing. This type of pattern typically signifies mounting bearish pressure. Therefore, if the price manages to break down below 1.38000, this should be perceived as a possible indication that the buying opportunity is now terminated. Conversely, a rebound from the Flag's upper boundary as well as the 1.38400 support would provide bulls with an opportunity to buy into the trend.
3. Concluding Remarks:
While the MACD indicator on the hourly chart above demonstrates peaking bullish momentum, this should not be taken as an indication that the price is ready to start falling. Instead, bulls should look to go long at the newest dip.
The 50-day MA (in green) and the 100-day MA (in blue) serve as floating supports, which can be used to determine a suitable level for placing a stop-loss order. It could be positioned close to the 1.38000 support, as it represents the marker below which the bullish opportunity would be terminated.
Meanwhile, the target levels for the upswing are listed above.
Time for GBPUSD Bears to Take Charge
Don`t rush to buy the dip! The clearly visible bearish rebound from the psychologically significant resistance level at 1.40000 for a third consecutive time implies that there is not enough bullish commitment in the market to break said barrier. On the other hand, there is a definite resurgence of bearish pressure in the short term.
The U.S. dollar found support recently after the global uptick in new coronavirus cases, which is causing a renewed demand for safe-havens. Even though this development is not enough to prompt a new downtrend in itself, it could serve as the catalyst for the development of a bigger correction.
Additionally, the value of the greenback is likely to be bolstered in light of the robust earnings season that is currently ongoing. In contrast, the expectations for moderate industry numbers in the UK tomorrow could put extra downwards pressure on the pound.
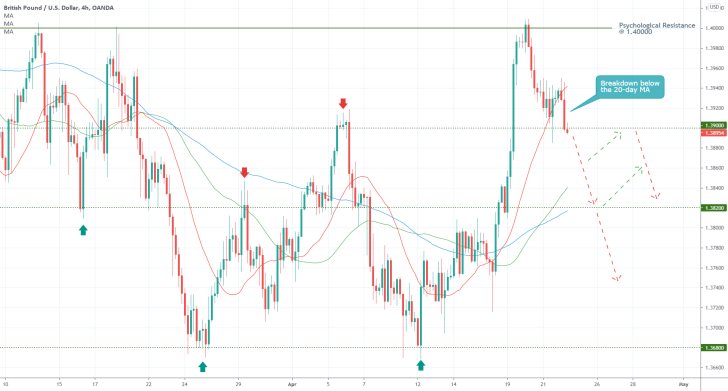
As can be seen on the 4H chart above, the GBPUSD is currently testing the resistance-turned-support at 1.39000, whose significance was established at the last swing peak. If it manages to break down below it decisively, then the next target for the bearish correction would be the major support level at 1.38200. The latter - a support-turned-resistance-turned-support again - bears significant importance as well.
Notice that the recent breakdown below the 20-day MA (in red) signifies the promptly rising bearish strength in the short-term. Meanwhile, the 50-day MA (in green) and the 100-day MA (in blue) are currently trading between the two price levels. These two floating supports could cause the price to change directions at any point.
While market bears can start looking for an opportunity to enter short around the current market price, they should also be cautious of sudden changes in the market sentiment. A bullish rebound from 1.39000 could therefore signal the potential termination of the selling opportunity.
GBPUSD Bears, You Need to Do More
The GBPUSD continues to display resilience to mounting bearish pressure, despite recent attempts to develop a new correction. The cable rose yesterday in the wake of FED's April policy meeting, but the upswing fell short of the psychologically significant resistance level at 1.40000.
The upswing resulted in a lower swing peak compared to the last time the price action came close to this major threshold, which gives some credence to the expectations for a snap reversal.
Moreover, the dollar is bound to strengthen eventually given the solid growth numbers of the U.S. economy for Q1 and the blowout earnings that are being posted by major U.S. companies for the same period.
The underlying buying and selling pressures on the GBPUSD are thus likely to be checked over the next several days, and the pair may finally be due for a healthy correction. This will depend on the manner in which the price behaves around several prominent supports.
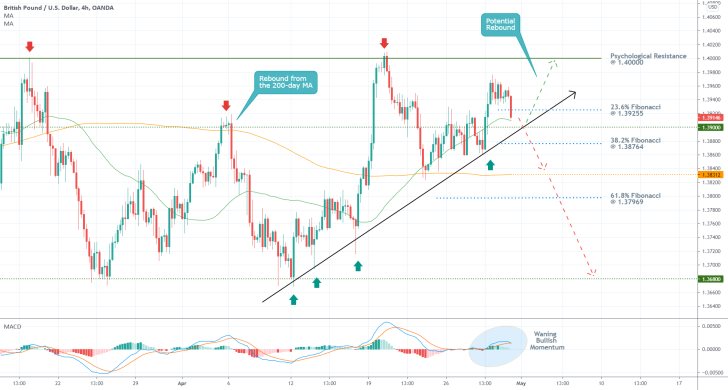
As can be seen on the 4H chart above, Jerome Powell's remarks from Wednesday caused the price action to break out above the minor consolidation range that emerged prior to FED's meeting. This breakout caused the price action to penetrate above the 1.39000 resistance, which had previously served as a prominent turning point.
At present, however, the price action looks ready to attempt breaking lower. The first test for the renewed bearish charge is encapsulated by the 23.6 per cent Fibonacci retracement level at 1.39255 and the 50-day MA (in green).
If the price action manages to break down below those two, then it would face its second test - penetrating below the ascending trend line (in black) and the resistance-turned-support level at 1.39255.
If successful, the GBPUSD would then be able to test the other two Fibonacci retracement levels, which are separated by the minor support level at 1.38312 (underpinned by the 200-day MA in orange). All three of these levels represent potential turning points.
Conversely, if the price action fails to break down below the ascending trend line, a resulting rebound could subsequently test the psychologically significant resistance levels at 1.40000.
As the underlying bullish momentum seems to be peaking - illustrated by the MACD indicator -, bearish pressure seems likely to start increasing. Ultimately, the deepest target for any potential correction is encapsulated by the 1.36800 support level.
The significance of the latter stems from the fact that it served as the last major swing low.
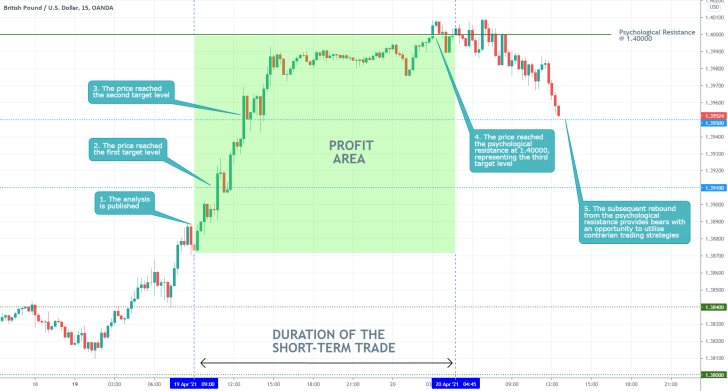
- The price action of the GBPUSD started to appreciate almost immediately after the publication of the analysis, as expected. The price action reached the psychologically significant resistance level at 1.40000, also as expected.
- The subsequent rebound from the latter allows bears to utilise contrarian trading strategies on the expectations for another bearish correction. Nevertheless, it should be mentioned that this would entail a high degree of risk in an otherwise trending environment.
- If the GBPUSD manages to break down below 1.39500, then the next target for the evolving correction would be the support level at 1.39100.
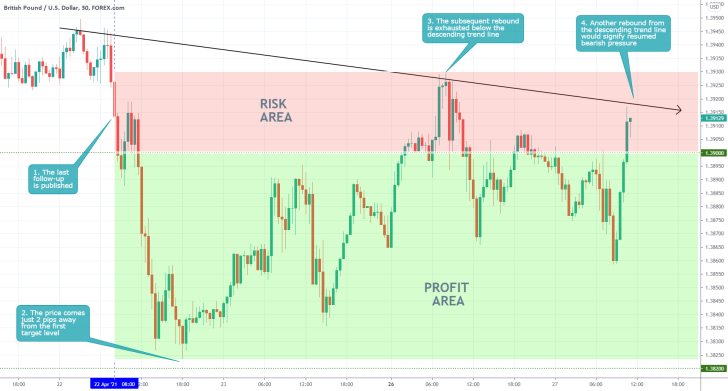
- Bearish pressure is starting to ramp up on the GBPUSD, as expected; however, the pair is not yet ready to establish a complete bearish reversal. The price action's current behaviour around the descending trend line would elucidate the likely direction for the pair in the immediate future.
- Notice that the initial dropdown came just two pips away from the first target level at 1.38200. Even though this is not detrimental for the overall setup, it showcases how the market tends to be volatile around major price levels that are eyed by bears and bulls alike.
- In other words, sudden changes in buying and selling pressures around major levels of support and resistance tend to cause such sharp changes in direction.
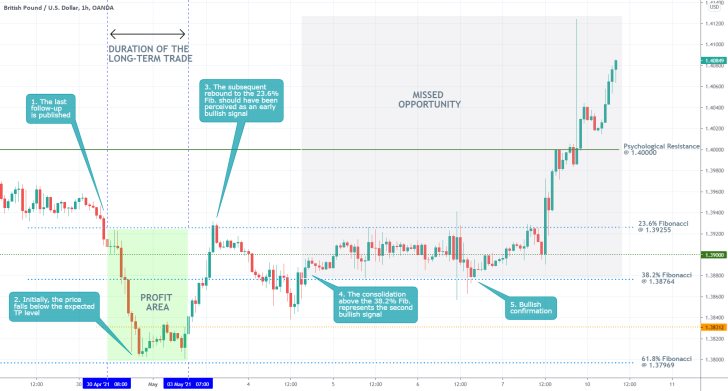
- In some regards, the last follow-up outperformed itself. The price action fell lower than initially expected, producing even higher profits. However, the subsequent change in the direction of the price action was not taken into account.
- The gradual consolidation of the price action above several crucial thresholds should have been taken into account, which would have allowed bulls to take advantage of the subsequent uptrend.
- Taking notice of the subtle changes in the underlying market bias is one of the most difficult aspects of trading to master. One of the most efficient ways to do this is to watch the swing peaks - is the price establishing higher/lower dips and peaks.
Disclaimer: Your capital is at risk! Trading and investing on the financial markets carries a significant risk of loss. Each material, shown on this website, is provided for educational purposes only. A perfect, 100% accurate method of analysis does not exist. If you make a decision to trade or invest, based on the information from this website, you will be doing it at your own risk. Under no circumstances is Trendsharks responsible for any capital losses or damages you might suffer, while using the company’s products and services. For more information read our Terms & Conditions and Risk Disclaimer.


