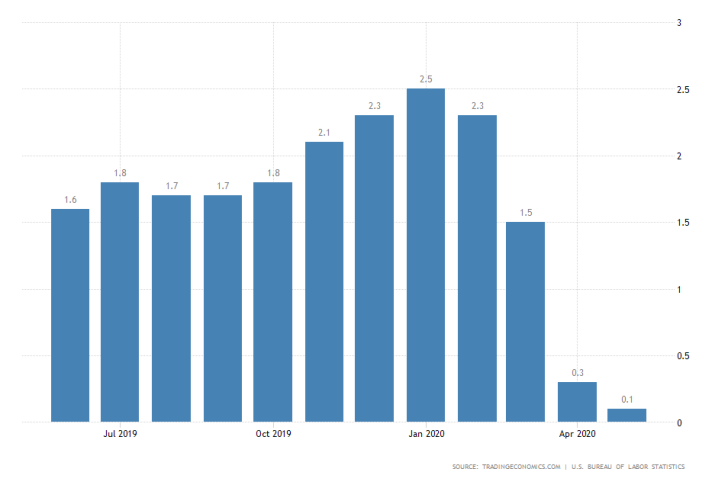
The Bureau of Labor Statistics in the US released its latest report of headline inflation and the recorded changes to the rate in May.
According to the findings of the report, the inflation rate contracted by 0.2 per cent the previous month, and is currently at the dismal 0.1 per cent. This poses a significant threat from deflation, despite FED's forward-looking economic projections, which were published yesterday as well.

The considerable contraction in the price stability that is being observed for the third consecutive month was attributed unsurprisingly to the governmental restrictions, which have been distorting economic activity since the beginning of the pandemic.
Moreover, the significant turmoil that swept across the energy market in the wake of the crisis, which led to the plummeting oil prices, is another reason for the shaken price stability in the American economy.
The energy market has steadied itself since then, and the price of crude is on the rise as a consequence. These conditions are needed to foster a gradual improvement in headline inflation, which is expected to near the 2 per cent symmetric target level around June 2022.
Nevertheless, the ongoing riotous protests across major US cities, which sprang up in the wake of George Floyd's murder, continue to pose a significant threat to the US retail sector.
A protracted civil unrest in the States could impede the expected growth in inflation, which, in turn, would extend the period needed for completing the recovery process.
Despite all of this, however, FED's overall optimistic projections from yesterday have supported the struggling dollar in the short term.
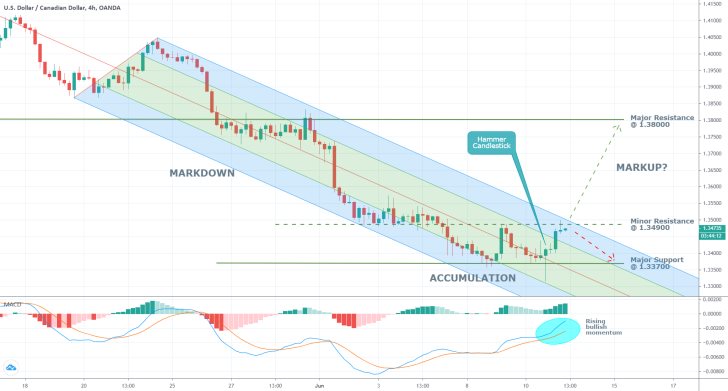
The greenback appears to have reached a new bottom against the Loonie, as the USDCAD attempts to form a new bullish correction.
As can be seen on the 4H chart below, the pair has managed to rebound from the major support level at 1.33700 and is currently attempting to form a breakout above the pitchfork tool's upper boundary.
This behaviour underlines the rising bullish sentiment in the market, which is also accommodated by the increasing momentum that is exhibited on the MACD.
If the underlying price action fails to do so, then a retracement to the support level is quite possible. However, the highlighted hammer candlestick, which is typically found at the lower end of bearish trends, could indicate the commencement of a new Markup.
The candle's emergence there favours the establishment of such a breakout.

Trendsharks Premium
Gold is undergoing a correction, as investors take profits to offset losses from falling stock prices, impacting their margins. However, we anticipate a renewed wave of [...]
The Swiss stock market index is mirroring its global counterparts, such as Germany 40 and US100, experiencing a sharp decline following the announcement of new [...]
We’re analyzing the weekly chart to grasp the broader market trend. Over the past three years, the US30 index has surged by 17,000 points, often resembling a nearly straight [...]
Over the past week, the DAX has experienced a sharp decline, plunging by an astonishing 3,400 points. This downward movement is not isolated, as its international counterparts, such as the UK100 and US100, are also facing significant [...]
EURUSD recently formed a double top at 1.0930, signaling a potential trend reversal, and has since begun a correction. After a 600-pip rally since early March, a pullback at this stage is both expected and healthy. Given these conditions, we are placing a [...]
Since early March, EURJPY has surged nearly 1,000 pips, providing us with several excellent trading opportunities. However, as the rally matures, many early buyers are beginning to take profits, leading to a noticeable slowdown in the uptrend. On Friday, the pair formed a [...]
The AUDJPY currency pair continues to be dominated by bullish momentum, as multiple golden cross patterns reaffirm the strength of the ongoing uptrend. Despite this, we are witnessing a much-needed [...]
The EURAUD currency pair appears to be undergoing a trend reversal, signaling a potential shift in market direction. A notable technical development is the formation of a Death Cross on the chart, a widely recognized bearish indicator that typically suggests a [...]
After securing an impressive 200-pip profit last week, the EURJPY currency pair is now undergoing a southward correction, retracing some of its recent gains. Despite this temporary pullback, the Golden Cross remains intact, reinforcing our view that the overall trend continues to be [...]
The appearance of a Golden Cross in Silver strengthens our analysis that the metal is currently in a strong uptrend, indicating further bullish momentum in the market. This technical pattern, where the short-term moving average crosses above the [...]
This trade presents a considerable level of risk and can be classified as an opportunistic move based on recent price action. The GBPUSD currency pair has experienced a substantial bullish rally, surging by nearly 500 pips in a strong upward movement. However, after this extended period of appreciation, the pair is showing signs of a potential [...]
The anticipated Death Cross on the SMI20 appears to be failing as price finds strong support at the 23% Fibonacci retracement level. After testing this area, the index has shown bullish strength, printing several large green candles, signaling an increase in [...]
A Golden Cross has just appeared on the USDJPY chart, signaling a potential bullish move. This technical pattern occurs when the 20 period moving average crosses above the 60 period moving average, a widely recognized indication of increasing [...]
After 2 months of a down trend, we finally see some indications of price recovery for Oil. The golden cross, a historic buy signal, supports this [...]
For the past month, the German DAX40 has experienced a remarkable 10% surge, reflecting strong bullish momentum. Despite ongoing market volatility and frequent pullbacks, every dip continues to attract fresh buyers, reinforcing the [...]
Oil continues its downward trajectory, despite occasional pullbacks. The overall trend remains bearish, reinforced by multiple Death Cross patterns, a classic sell signal indicating further weakness. Adding to this bearish outlook, the critical [...]
Over the past few days, gold has experienced a sharp decline of more than $100. This downturn can be attributed in part to traders securing profits to manage their margins, which are under strain due to the significant drop in major indices. Currently, gold has fallen below the [...]
The NASDAQ 100 index is showing strong bullish momentum, as evidenced by the formation of a Golden Cross on the chart. This classic buy signal occurs when the short moving average crosses above the long term moving average, suggesting that upward momentum is [...]
The EURAUD currency pair has encountered a significant resistance level, failing to break above the critical 61% Fibonacci retracement level. This suggests that bullish momentum is weakening, reinforcing the case for a potential downward move. Given this technical setup, we favor entering a [...]
The UK100 is experiencing a remarkable rally! Over the past few weeks, the British stock market index has surged nearly 800 points. Each minor dip has attracted more buyers, fueling the bullish momentum. However, since last week, we’ve observed a slight [...]


