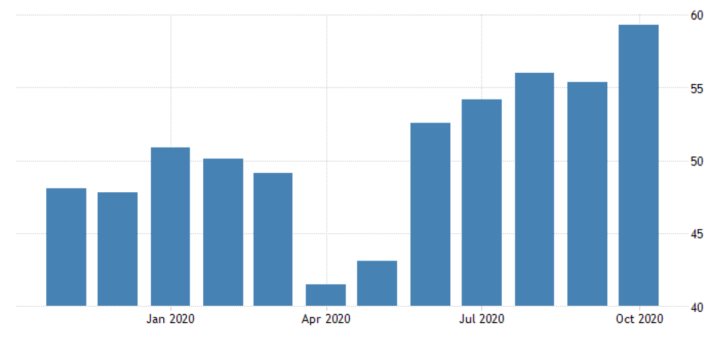
The Institute for Supply Management just released the manufacturing PMI data for October, which drastically exceeded the initial market forecasts. According to the findings of the report, US manufacturing rose to 59.3 index points the previous month, beating the consensus forecasts for a moderate rise to 55.6 index points.
The American economy has been consistently exhibiting signs of stabilisation over the previous couple of months, and manufacturing takes the cake as one of the best-performing sectors of industry.

As can be seen on the graph above, manufacturing has been consistently improving in the third quarter, even outgrowing the recorded performance prior to the outbreak of the coronavirus crisis.
The industry numbers for October come hours before the crucially important Presidential Election in the US, as manufacturing represents a central battleground for the two candidates. Donald Trump has taunted on multiple occasions the robustness of US manufacturing as being the result of his protectionist policies.
The impact of today's economic report on the dollar could easily be discounted by the other top-tier events taking place in this action-packed week. However, the better-than-expected data is likely to support the reeling stock market, particularly the Dow Jones Industrial Average.
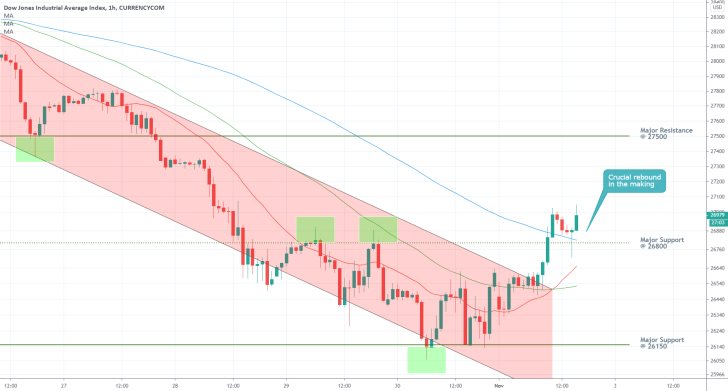
As can be seen on the hourly chart below, the index has recently broken out above the upper boundary of a major descending channel. Following the rebound from the major support level at 26150, the price action looks poised to test the major resistance level at 27500 next.
The more than welcoming data from today is likely to foster such an upswing. As regards the technical outlook, several key developments also warrant closer attention.
After the DJI broke out above the minor resistance (currently support) level at 26800, the subsequent bearish pullback was terminated above set support, and also above the 100-day MA (in blue).
The resulting hammer candlestick represents a major indication that the price action is likely to continue trading higher in the immediate future.
While the 20-day MA (in red) shot above the 50-day MA (in green), the two remain concentrated below the 100-day MA. This means that the reversal is too recent and that the bears still retain some level of control.
In other words, do not expect the price action to continue appreciating uninterrupted, and be prepared for more adverse fluctuations and unexpected pullbacks.

Trendsharks Premium
Gold is undergoing a correction, as investors take profits to offset losses from falling stock prices, impacting their margins. However, we anticipate a renewed wave of [...]
The Swiss stock market index is mirroring its global counterparts, such as Germany 40 and US100, experiencing a sharp decline following the announcement of new [...]
We’re analyzing the weekly chart to grasp the broader market trend. Over the past three years, the US30 index has surged by 17,000 points, often resembling a nearly straight [...]
Over the past week, the DAX has experienced a sharp decline, plunging by an astonishing 3,400 points. This downward movement is not isolated, as its international counterparts, such as the UK100 and US100, are also facing significant [...]
EURUSD recently formed a double top at 1.0930, signaling a potential trend reversal, and has since begun a correction. After a 600-pip rally since early March, a pullback at this stage is both expected and healthy. Given these conditions, we are placing a [...]
Since early March, EURJPY has surged nearly 1,000 pips, providing us with several excellent trading opportunities. However, as the rally matures, many early buyers are beginning to take profits, leading to a noticeable slowdown in the uptrend. On Friday, the pair formed a [...]
The AUDJPY currency pair continues to be dominated by bullish momentum, as multiple golden cross patterns reaffirm the strength of the ongoing uptrend. Despite this, we are witnessing a much-needed [...]
The EURAUD currency pair appears to be undergoing a trend reversal, signaling a potential shift in market direction. A notable technical development is the formation of a Death Cross on the chart, a widely recognized bearish indicator that typically suggests a [...]
After securing an impressive 200-pip profit last week, the EURJPY currency pair is now undergoing a southward correction, retracing some of its recent gains. Despite this temporary pullback, the Golden Cross remains intact, reinforcing our view that the overall trend continues to be [...]
The appearance of a Golden Cross in Silver strengthens our analysis that the metal is currently in a strong uptrend, indicating further bullish momentum in the market. This technical pattern, where the short-term moving average crosses above the [...]
This trade presents a considerable level of risk and can be classified as an opportunistic move based on recent price action. The GBPUSD currency pair has experienced a substantial bullish rally, surging by nearly 500 pips in a strong upward movement. However, after this extended period of appreciation, the pair is showing signs of a potential [...]
The anticipated Death Cross on the SMI20 appears to be failing as price finds strong support at the 23% Fibonacci retracement level. After testing this area, the index has shown bullish strength, printing several large green candles, signaling an increase in [...]
A Golden Cross has just appeared on the USDJPY chart, signaling a potential bullish move. This technical pattern occurs when the 20 period moving average crosses above the 60 period moving average, a widely recognized indication of increasing [...]
After 2 months of a down trend, we finally see some indications of price recovery for Oil. The golden cross, a historic buy signal, supports this [...]
For the past month, the German DAX40 has experienced a remarkable 10% surge, reflecting strong bullish momentum. Despite ongoing market volatility and frequent pullbacks, every dip continues to attract fresh buyers, reinforcing the [...]
Oil continues its downward trajectory, despite occasional pullbacks. The overall trend remains bearish, reinforced by multiple Death Cross patterns, a classic sell signal indicating further weakness. Adding to this bearish outlook, the critical [...]
Over the past few days, gold has experienced a sharp decline of more than $100. This downturn can be attributed in part to traders securing profits to manage their margins, which are under strain due to the significant drop in major indices. Currently, gold has fallen below the [...]
The NASDAQ 100 index is showing strong bullish momentum, as evidenced by the formation of a Golden Cross on the chart. This classic buy signal occurs when the short moving average crosses above the long term moving average, suggesting that upward momentum is [...]
The EURAUD currency pair has encountered a significant resistance level, failing to break above the critical 61% Fibonacci retracement level. This suggests that bullish momentum is weakening, reinforcing the case for a potential downward move. Given this technical setup, we favor entering a [...]
The UK100 is experiencing a remarkable rally! Over the past few weeks, the British stock market index has surged nearly 800 points. Each minor dip has attracted more buyers, fueling the bullish momentum. However, since last week, we’ve observed a slight [...]


