In the second crucially important interest rate decision of a major central bank this week, the Bank of Japan quite expectedly decided to maintain is negative Policy Rate unchanged at -0.10 per cent.
The Policy Board Members of the BOJ outlined their recalibrated economic projections, which entail a general recovery at a moderate pace through 2022 as the impact of the coronavirus crisis wanes.
"Japan's economy is likely to follow an improving trend with economic activity resuming and the impact of the novel coronavirus (COVID-19) waning gradually, but the pace is expected to be only moderate while vigilance against COVID-19 continues. Thereafter, as the impact subsides globally, the economy is projected to keep improving further with overseas economies returning to a steady growth path."
The Bank, however, wearily acknowledged that its projections are based on a broad scenario underpinned by a lot of uncertainties. Chiefly, that:
"The outlook is based on the assumption that COVID-19 will not spread again on such a large scale that the wide-ranging public health measures will need to be reinstated."
The general experience from recent developments in Europe and the US run contrary to such expectations, as the pandemic continues to deepen in the Northern hemisphere.
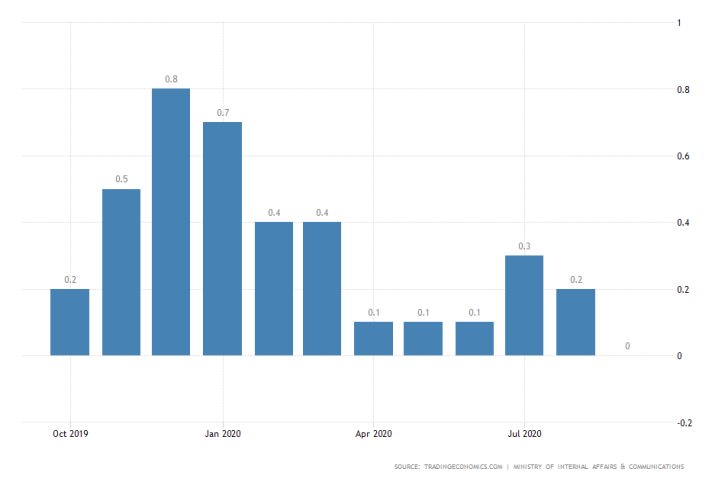
Meanwhile, subdued inflationary pressures in Japan could further stave off the road to recovery, as aggregate demand remains weak. As can be seen from the graph below, headline inflation was recorded at 0.0 per cent in September.

The general price stability could remain jolted over the next several weeks, given the underlying tribulations in the energy market. Falling oil prices would dampen aggregate demand, particularly as parts of the world consider going into lockdown once again.
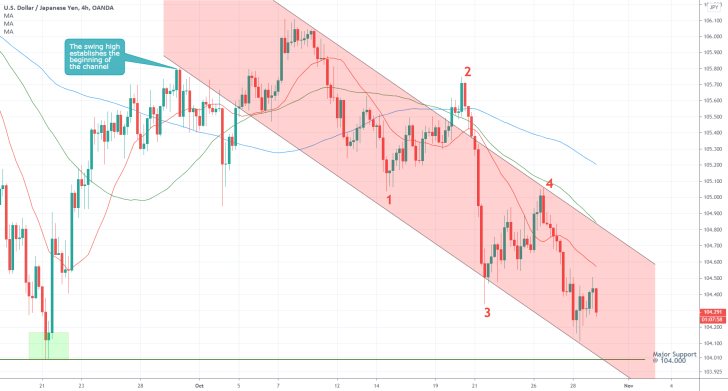
The 4H price chart below underpins these developments' adverse impact on the USDJPY, as investors scramble for safe-havens such as the yen. As can be seen, the pair is establishing a new downtrend.
The price action is currently drawing near to the psychologically significant support level at 104.000, which has already served as a prominent turning point on at least three occasions in the past.
The emerging downtrend, being outlined by the descending channel, is taking the form of a 1-5 impulse wave pattern, as postulated by the Elliott Wave Theory. Evidently, the price action is currently developing the final impulse leg (4-5), which could test the strength of the aforementioned support level.
Meanwhile, the descending order of the three moving averages – the 100-day MA (in blue), the 50-day MA (in green), and the 20-day MA (in red) – illustrates the strong bearish bias in the market.

Trendsharks Premium
Gold is undergoing a correction, as investors take profits to offset losses from falling stock prices, impacting their margins. However, we anticipate a renewed wave of [...]
The Swiss stock market index is mirroring its global counterparts, such as Germany 40 and US100, experiencing a sharp decline following the announcement of new [...]
We’re analyzing the weekly chart to grasp the broader market trend. Over the past three years, the US30 index has surged by 17,000 points, often resembling a nearly straight [...]
Over the past week, the DAX has experienced a sharp decline, plunging by an astonishing 3,400 points. This downward movement is not isolated, as its international counterparts, such as the UK100 and US100, are also facing significant [...]
EURUSD recently formed a double top at 1.0930, signaling a potential trend reversal, and has since begun a correction. After a 600-pip rally since early March, a pullback at this stage is both expected and healthy. Given these conditions, we are placing a [...]
Since early March, EURJPY has surged nearly 1,000 pips, providing us with several excellent trading opportunities. However, as the rally matures, many early buyers are beginning to take profits, leading to a noticeable slowdown in the uptrend. On Friday, the pair formed a [...]
The AUDJPY currency pair continues to be dominated by bullish momentum, as multiple golden cross patterns reaffirm the strength of the ongoing uptrend. Despite this, we are witnessing a much-needed [...]
The EURAUD currency pair appears to be undergoing a trend reversal, signaling a potential shift in market direction. A notable technical development is the formation of a Death Cross on the chart, a widely recognized bearish indicator that typically suggests a [...]
After securing an impressive 200-pip profit last week, the EURJPY currency pair is now undergoing a southward correction, retracing some of its recent gains. Despite this temporary pullback, the Golden Cross remains intact, reinforcing our view that the overall trend continues to be [...]
The appearance of a Golden Cross in Silver strengthens our analysis that the metal is currently in a strong uptrend, indicating further bullish momentum in the market. This technical pattern, where the short-term moving average crosses above the [...]
This trade presents a considerable level of risk and can be classified as an opportunistic move based on recent price action. The GBPUSD currency pair has experienced a substantial bullish rally, surging by nearly 500 pips in a strong upward movement. However, after this extended period of appreciation, the pair is showing signs of a potential [...]
The anticipated Death Cross on the SMI20 appears to be failing as price finds strong support at the 23% Fibonacci retracement level. After testing this area, the index has shown bullish strength, printing several large green candles, signaling an increase in [...]
A Golden Cross has just appeared on the USDJPY chart, signaling a potential bullish move. This technical pattern occurs when the 20 period moving average crosses above the 60 period moving average, a widely recognized indication of increasing [...]
After 2 months of a down trend, we finally see some indications of price recovery for Oil. The golden cross, a historic buy signal, supports this [...]
For the past month, the German DAX40 has experienced a remarkable 10% surge, reflecting strong bullish momentum. Despite ongoing market volatility and frequent pullbacks, every dip continues to attract fresh buyers, reinforcing the [...]
Oil continues its downward trajectory, despite occasional pullbacks. The overall trend remains bearish, reinforced by multiple Death Cross patterns, a classic sell signal indicating further weakness. Adding to this bearish outlook, the critical [...]
Over the past few days, gold has experienced a sharp decline of more than $100. This downturn can be attributed in part to traders securing profits to manage their margins, which are under strain due to the significant drop in major indices. Currently, gold has fallen below the [...]
The NASDAQ 100 index is showing strong bullish momentum, as evidenced by the formation of a Golden Cross on the chart. This classic buy signal occurs when the short moving average crosses above the long term moving average, suggesting that upward momentum is [...]
The EURAUD currency pair has encountered a significant resistance level, failing to break above the critical 61% Fibonacci retracement level. This suggests that bullish momentum is weakening, reinforcing the case for a potential downward move. Given this technical setup, we favor entering a [...]
The UK100 is experiencing a remarkable rally! Over the past few weeks, the British stock market index has surged nearly 800 points. Each minor dip has attracted more buyers, fueling the bullish momentum. However, since last week, we’ve observed a slight [...]


