Why is everybody so scared about the yield curve turning negative?
The essential news from last week that rattled the financial markets and raised investor concerns for the global economy was the inversion of the US yield curve of government bonds. But what exactly does that mean and why should we care?
The curve itself is a composite indicator of US government debt, showcasing the relationship between the maturity of various US government bonds, with expiry dates ranging from 1 month to 30 years, and their yields. Essentially, when the demand for government debt rises that also increases the prices of set bonds at the expense of depreciating yield.
Hence, when investors perceive the economy to be doing well the demand for short-term bonds, most notably the 3-month US bond, increases and respectively their yield falls. However, should the yield of short-term bonds increase this could potentially indicate that various investors are wary about the state of affairs and the current economic outlook.
So out of fears for a possible recession, they would be opting to invest in government bonds with long-term maturity, such as the 10-year government bond, because these securities are perceived to protect the investor capital against shrinkages of the economy.
What everybody is worried about presently is the fact that for the first time in over a decade the yield curve has inverted, meaning that the yield of short-term bonds has surpassed the yield of long-term government debt securities. This inversion indicates a trend amongst multiple investors and their intention of moving their capital into more steady assets, betting against the possibility of a sustained economic slowdown.
Investors worldwide are worried because the yield curve is a measurement of the health of the US economy and an inverted yield curve could potentially alert against a forthcoming debt bubble burst, similar to the one that triggered the 2008 credit crunch. Because of the interconnectedness of the global economy, despite even the current trade impediments of global trade caused by the US/China trade war, any debt woes in the world's biggest economy can very easily be transferred worldwide. The same global spillover effect was reflected on the global economic output back then, after the bankruptcy of Lehman Brothers and the resulting US banking sector crisis.
The main financial distress presently is stemming from the parallels between the yield curve in the wake of 2008's credit crunch and its recent developments, so the main question is whether the debt situation is indeed the same now, as it was back then, and what is the yield curve really indicating?

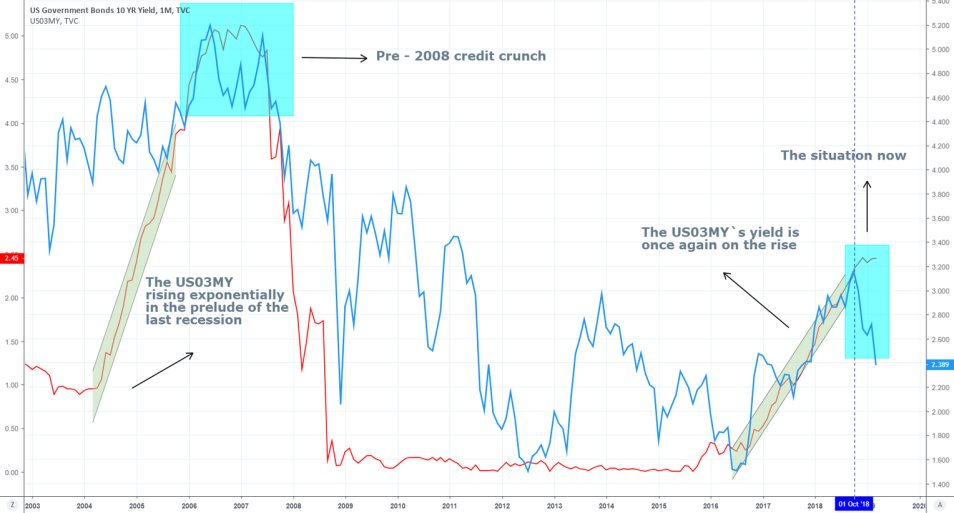
This graph represents the relationship between the yields of the 10-year US government bond (in blue) and the 3-month US government bond (in red). The chart indicates very clearly that the last time the short-term yield surpassed its long-term counterpart, the market entered into the largest economic crisis in this 21st century and the same situation is happening right now.
Even though the US03MY's appreciation angle is not as steep now as it was in the prelude years to the credit crunch, its intensifying momentum is enough to confirm the existence of investors doubts about the present state of affairs, concerning the US economy. But does this relationship between the two bonds play a part in the causation of economic recessions or is it simply a coincidental symptom of a potential economic slump?
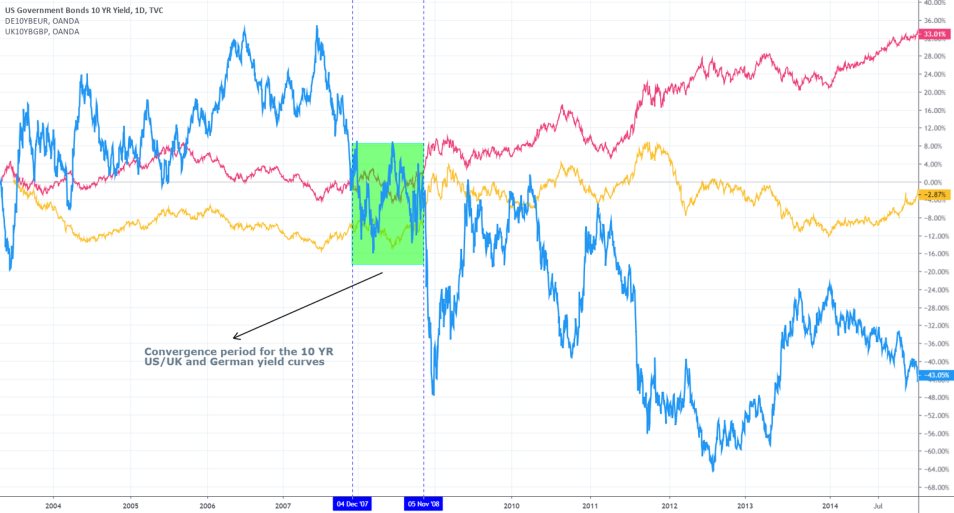
Judging by the comparison of the 10-year US government yield, the 10-year Gilt (United Kingdom) and the 10-year Bund (Germany) around the time of the 2008 credit crunch, we can deduce that there was a convergence in the yields of the three, yet it was only the US government bond that experienced any sizable slump and its two European counterparts remained in a relative horizontal parity.
Therefore, it could be argued that economic recessions originating from the US can be characterized by such declines in US Treasuries’ yields, however, even if there is any spill over-effect between the declining US treasuries and the respective global bonds, it does not show any immediate impact on the charts.

What factors caused the yield to invert itself?
It should be evident that the curve itself does not necessarily compel investors` decisions on the financial markets, however, it most certainly outlines their impact on US debt. For that reason, thinking of the curve as a gauge of upcoming periods of economic expansions and contractions, though not entirely devoid of logic, might be misleading. If we want to talk with certainties then the yield curve should be perceived as it is – a representation of investors activity, without necessarily showing what compelled them to act as they do, and its impact on US bonds.
Therefore, it can be argued that there are two distinct reasons which are currently forcing investors to bet on longer-term government securities rather than short-term ones – the US debt reaching all-time high levels and the aforementioned international trade woes.
Fears over the possibility of the debt bubble bursting again
The US national debt topped $22 trillion in mid-February and, apart from setting an all-time record, accounted for $1 trillion increase in the previous 11 months alone according to the Peterson Foundation, which has given credence to the speculations that President's Trump's protectionist policies are straining the US economy more than previously thought. Investors are worried that in case that the debt is carelessly allowed to mount up at the present rate, eventually the debt bubble is going to burst, similarly to what happened in 2007, and that is going to be the underlying cause for the next economic recession.
In the early 2000's the banking sector in the US was allowed to purchase and resell debt assets almost unchecked by financial regulators, resulting in an ever-growing chain of debt transmitting which once thorn apart, made it nearly impossible to backtrack to the initial source of the debt. Ergo, multiple counterparts of various economic transactions almost simultaneously defaulted on their debt obligations, which triggered the simultaneous debt bubble burst in 2007.
This time there are a lot of new credit derivative regulations in place, put there by big regulatory bodies such as the FCA in the UK and the FCC in the US, as a countermeasure against such subversive and reckless gambling with public debt. However, this time the investor concerns stem from the fact that the economic growth rate is outpaced by the speed with which the US debt is growing.
Everything would be well if the growth levels were meeting the expectations, however, the reality is that some of the biggest economies across the globe all experience the same thing. Inflation keeps missing the targeted levels, which on the other hand already compelled the FED, ECB, BOJ, RBA and the RBNZ to maintain their interest levels, prompting at the potential future lowering of their respective rates.
Owing to these financial concerns investors are increasingly looking to hedge their financial risks of a short-term economic slump by moving their capitals to longer-lasting financial securities. For that reason, the yield curve is presently shifting its course as the higher demand for long-term bonds is lowering their yields (just like in 2007) and increasing their prices, meanwhile, the decreasing interest in short-term debt assets is having a detrimental effect for their prices, while their yields are on the rise.
The hampered international trade
Much has already been said about the stubbornness of Donald Trump and his Chinese counterpart Xi Jinping and their notorious trade war, however, the prolonged stampede of the mutual imposition of trade tariffs has definitely severed the global economic output, precisely because of the aforementioned interconnectedness of the global economy.
Several prominent central banks, such as the ones listed above, have already expressed concerns over the gloomy prospects for local economic growth until the rest of the year and all of them have attributed the barriers to international trade as the number one reason for this.
Almost all of them have responded to the issue in a similar manner – keep the interest rates low with the potential to lower them even further if the situation continues to be as it is, as well as committing to meeting their inflation rate targets. However, this economic slowdown is not a sufficiently strong reason to cause a recession on its own, as the economic cycle naturally follows periods of expansions and contractions.
Ergo, the shifting tone in the US bond market can be attributed to political causes as much as economic ones, most notably Trump's policy of America First. Moreover, the inverted yield curve is reflecting the market's scepticism towards the efficiency of the newly imposed tariffs, which does not necessarily mean that an economic crisis is imminent.
Why the situation now is different compared to the credit crunch of 2008?
For one, the global economic system survived the last financial crisis and as a result, become more resilient and better prepared to face future challenges. For instance, the derivatives market in the wake of the credit crunch was vastly unregulated and left alone by the financial authorities, which made it possible for various traders and speculators to take advantage of the system by frantically exchanging debt assets on a margin that was higher than what they could actually cover.
The clearinghouses in major exchanges, such as the CBOE and the CME, have been given a lot more functions now in the dealership and for overseeing the transaction process of every trade, from its inception to its execution, significantly decreasing the prospects of defaulting on any transaction. The exchange members can now rest assured that there is a safety net in place and it would be a lot harder for any debt woes to be transmitted across the exchange, even in the case of a bankruptcy of one of its members.
But above all else, even if the inverted yield curve is really the first major implication for a possible future economic slump, that should not worry the market, and actually, it should not surprise anybody either. As previously mentioned, economic recessions are a natural part of the broader economic cycle and their future occurrences cannot be subverted.
However, given the current safety net measures in place and the adequate monetary policies by the major central banks, there is nothing out there to indicate that the eventual economic recession is going to be similar in any way to the severity of the economic crunch of 2008, not even the inverted yield curve.


