This article is the first entry in a series of materials we intend to publish examining the significance of various candles and price patterns and how they can be used in trading.
By far, the most popular approach to trading involves the careful examination of past price action - technical analysis - in an attempt to forecast the likely future behaviour of a given asset's price. Chartists look for predictable patterns in the price action that appear regularly as a means of determining whether the market is driven by bullish or bearish pressures.
The significance of such patterns stems from the fact that the majority of traders believe what they are said to signify. In other words, the market only moves in a predictable manner if traders are convinced of the significance of the structures they perceive on the chart.
That is why it is vitally important to understand the difference between what a given candle or pattern is said to indicate and how traders structure their positions after they spot such formations.
Before we can move on to complex price structures, it is worthwhile to understand the functioning of simpler candlesticks. In today's article, we pay attention to the bearish 'Shooting Star' and bullish 'Hammer', which are each other's mirrored images.
When to expect a likely bearish reversal following a shooting star candle
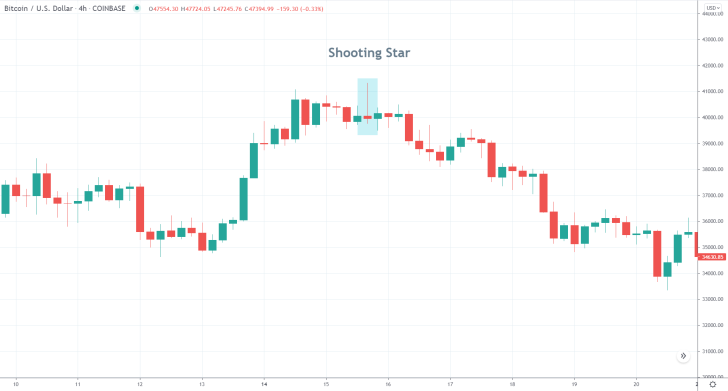
Shooting stars are commonly found near the peaks of recent uptrends and upswings. Their emergence is usually taken to signify likely reversals from said peaks, potentially leading to the emergence of a new downtrend.

Shooting stars usually have small bodies and huge upper shadows. If it weren't for the latter, they would be indistinguishable from regular Doji candles. This structure is the result of the changing buying and selling pressures throughout the duration of the candle.
Initially, the price starts to rise in an attempt to continue driving the existing uptrend higher. A swift change in the market sentiment then ensues, with the price action changing directions. The candle proceeds to close below its opening price.
However, traders should not rush to place new selling orders every time they see a shooting star on the chart. This type of candle could emerge within an established trend without it having to signal an imminent reversal necessarily. That is why bears need to look for other indications that are congruent with the expectation of a reversal.

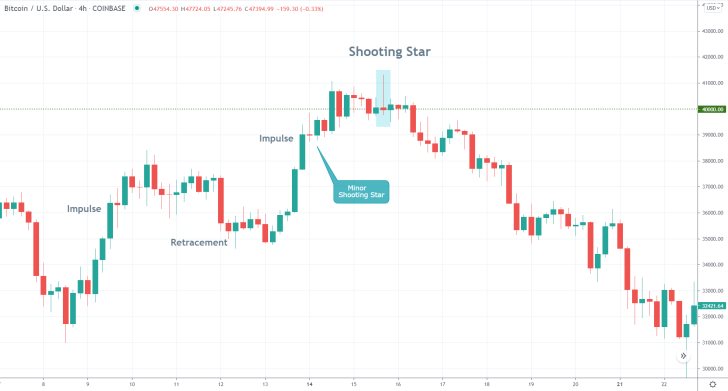
There are two shooting stars of interest on the 4H chart above. The first (minor) one emerged while the price action was still advancing within a classic ABCD pattern, comprised of two impulse legs and one retracement leg. It developed just below the psychologically significant resistance level at 40000.00.
The impact of mass-market psychology is such that traders should not rush to place orders around similar significant turning points on the first early signals of a potential reversal/rebound.
Once having established a fake breakout above the psychological resistance, the subsequent development of a shooting star represents a completely different story. The second shooting star indicates rapidly rising selling pressure in the short term, but this time this behaviour is congruent with the expectations for a reversal.
That is why traders can easily discern that other market participants are more likely to bet on such a turn of events as well. Hence, there is a pretty solid case to be made here that more and more traders are entering short around the psychological resistance, not just below it, which validates the underlying expectations.
When to expect a likely bullish rebound following a hammer candle
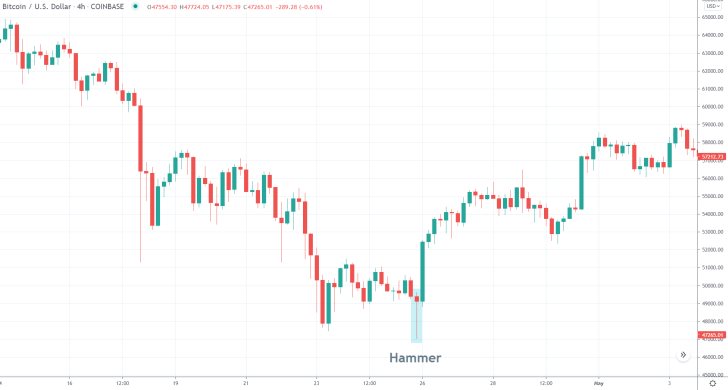
As was mentioned in the introduction, a hammer candlestick is essentially a mirrored shooting star. It has a massive lower tail and a small body. Hammers are typically found at the bottom of bearish trends and signify likely bullish rebounds.

Similarly to what was said with regards to shooting stars, bulls should avoid buying into the market every time they spot a hammer on the chart. Additionally, traders should keep in mind that candlesticks do not stop being important right after their close. I other words, they can be traded even shortly after their completion.
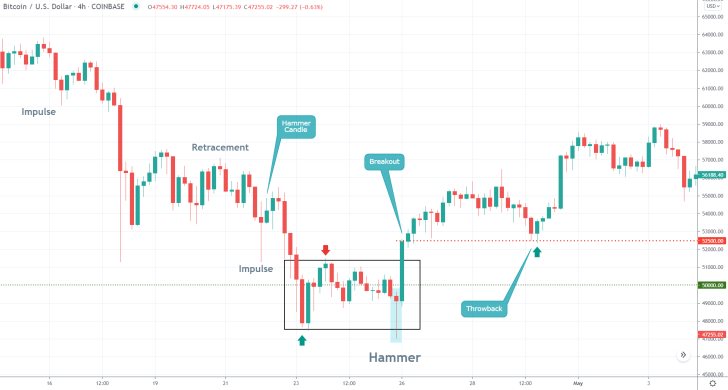
As can be seen on the 4H chart below, not all hammers entail imminent bullish rebounds. However, when there is a confluence of bullish indicators, the likelihood of such a change in the direction of the market is bolstered.
The correction reached a dip just below the psychologically significant support level at 50000.00, signified by the Hammer. The subsequent rebound then managed to break out above the consolidation range, which represented a good opportunity to go long.


