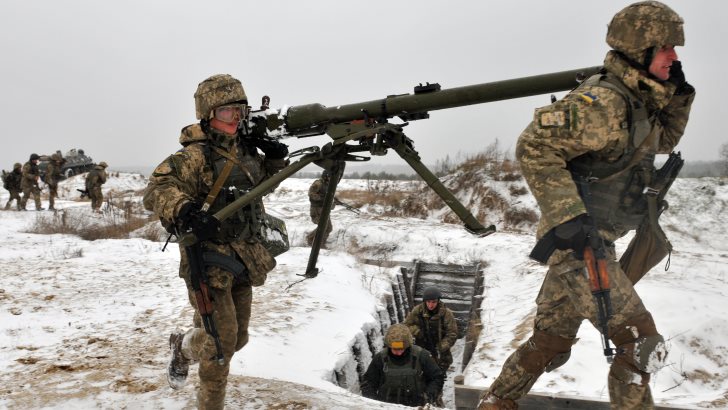
Two Ukrainian Soldiers assigned to 1st Battalion, 80th Airmobile Brigade carry a SPG-9 recoilless rifle after conducting an air assault mission in conjunction with a situational training exercise led by Soldiers from 6th Squadron, 8th Cavalry Regiment, 2nd Infantry Brigade Combat Team, 3rd Infantry Division. Image source: U.S. Army Europe, flickr.com
The world holds its breath as the prospect of a war between Russia and Ukraine seems to loom larger as U.S. President Joe Biden recently stated that Vladimir Putin, the President of Russia, has already made up his mind to attack to invade. And while the latter continues to deny the accusations, the amount of Russian troops massing near the Ukrainian border is still increasing.
It is impossible to predict with absolute certainty how the situation will evolve next, though the behaviour of the energy market may elucidate the sentiments of investors as they weigh in on each development. Judging by the current behaviour of the price action on both crude oil and natural gas, the market seems more inclined to believe that there would be a peaceful resolution to the situation. Here is why:
History (and market seasonality) matter

Natural Gas and Crude Oil Comparison Chart 2014. Image source: TradingEconomics.com
The energy market behaved quite unexpectedly back in 2014, following the Russian invasion and eventual annexation of Crimea. Firstly, it is important to note that Russia remains the largest exporter of natural gas to Europe and a key member of OPEC +, which is why the energy market is so responsive to the geopolitical situation in the country.
What can be discerned on the comparison chart above is that demand for natural gas was bolstered quite significantly in the prelude to the 2014 conflict, adding to the seasonal upsurge in demand that was already being observed towards the end of the year. Adverse volatility on natural gas was exploding while crude oil, though still in an uptrend, was lagging far behind.
Then, quite surprisingly, the day that Russian troops entered Crimea, the price of natural gas collapsed. If the prolonged threat of war had been the catalyst of the rally, then the actual invasion was the release that completely reversed the animal spirits. And since volatility spikes underpin heightened market speculation, we can discern that back in 2014, the animal spirits were expecting the eventual escalation of tensions in Crimea.
Volatility levels this time around are considerably more subdued

Natural Gas and Crude Oil Comparison Chart 2022. Image source: TradingEconomics.com
This time around, however, the market seems conspicuously unfazed by the likelihood of Russia invading the rest of Ukraine, at least with regards to the behaviour of the price of natural gas on the second comparison chart above. Even though adverse volatility has been rising steadily since the 10th of December, the price remains well below the levels that were observed beforehand.
The rally that was recorded between early April and early October was at its strongest when seasonal demand was also at its highest. It follows that, unlike in 2014, this time speculations of a potential invasion seem a lot more subdued. Therefore, it is prudent to ask what might cause the next selloff on natural gas.

Natural Gas 1D Price Chart. Image source: Trendsharks ©, created with TradingView.com
The new downtrend may have already begun developing, given what can be seen on the daily price chart above. It commenced following the decisive breakdown below the Pennant on top of the previous rally. The breakdown itself was then followed by a throwback to the lower limit of the Pennant, which was converging with the 23.6 per cent Fibonacci retracement level at 5.572 at that time. This confirmed the latter's new role as a major resistance level.
However, the subsequent dropdown was then terminated at the 61.8 per cent Fibonacci at 4.020, as tensions started rising alongside Ukraine's border with Russia in late 2021. This underpins the existence of a major Support Area (in green) just below the 61.8 per cent Fibonacci.
At present, the adverse volatility is driving the price action, which is likely to reach either one of the two Fibonacci thresholds above. The eventual reversal from either the psychologically significant barrier at 5.000 or the major resistance at 5.572 would thus signal the likely continuation of the downtrend. Bears can take advantage of this by potentially implementing trend-continuation strategies.

Gold is undergoing a correction, as investors take profits to offset losses from falling stock prices, impacting their margins. However, we anticipate a renewed wave of [...]

The Swiss stock market index is mirroring its global counterparts, such as Germany 40 and US100, experiencing a sharp decline following the announcement of new [...]

We’re analyzing the weekly chart to grasp the broader market trend. Over the past three years, the US30 index has surged by 17,000 points, often resembling a nearly straight [...]

Over the past week, the DAX has experienced a sharp decline, plunging by an astonishing 3,400 points. This downward movement is not isolated, as its international counterparts, such as the UK100 and US100, are also facing significant [...]

EURUSD recently formed a double top at 1.0930, signaling a potential trend reversal, and has since begun a correction. After a 600-pip rally since early March, a pullback at this stage is both expected and healthy. Given these conditions, we are placing a [...]

Since early March, EURJPY has surged nearly 1,000 pips, providing us with several excellent trading opportunities. However, as the rally matures, many early buyers are beginning to take profits, leading to a noticeable slowdown in the uptrend. On Friday, the pair formed a [...]

The AUDJPY currency pair continues to be dominated by bullish momentum, as multiple golden cross patterns reaffirm the strength of the ongoing uptrend. Despite this, we are witnessing a much-needed [...]

The EURAUD currency pair appears to be undergoing a trend reversal, signaling a potential shift in market direction. A notable technical development is the formation of a Death Cross on the chart, a widely recognized bearish indicator that typically suggests a [...]

After securing an impressive 200-pip profit last week, the EURJPY currency pair is now undergoing a southward correction, retracing some of its recent gains. Despite this temporary pullback, the Golden Cross remains intact, reinforcing our view that the overall trend continues to be [...]

The appearance of a Golden Cross in Silver strengthens our analysis that the metal is currently in a strong uptrend, indicating further bullish momentum in the market. This technical pattern, where the short-term moving average crosses above the [...]

This trade presents a considerable level of risk and can be classified as an opportunistic move based on recent price action. The GBPUSD currency pair has experienced a substantial bullish rally, surging by nearly 500 pips in a strong upward movement. However, after this extended period of appreciation, the pair is showing signs of a potential [...]

The anticipated Death Cross on the SMI20 appears to be failing as price finds strong support at the 23% Fibonacci retracement level. After testing this area, the index has shown bullish strength, printing several large green candles, signaling an increase in [...]

A Golden Cross has just appeared on the USDJPY chart, signaling a potential bullish move. This technical pattern occurs when the 20 period moving average crosses above the 60 period moving average, a widely recognized indication of increasing [...]

After 2 months of a down trend, we finally see some indications of price recovery for Oil. The golden cross, a historic buy signal, supports this [...]

For the past month, the German DAX40 has experienced a remarkable 10% surge, reflecting strong bullish momentum. Despite ongoing market volatility and frequent pullbacks, every dip continues to attract fresh buyers, reinforcing the [...]

Oil continues its downward trajectory, despite occasional pullbacks. The overall trend remains bearish, reinforced by multiple Death Cross patterns, a classic sell signal indicating further weakness. Adding to this bearish outlook, the critical [...]

Over the past few days, gold has experienced a sharp decline of more than $100. This downturn can be attributed in part to traders securing profits to manage their margins, which are under strain due to the significant drop in major indices. Currently, gold has fallen below the [...]

The NASDAQ 100 index is showing strong bullish momentum, as evidenced by the formation of a Golden Cross on the chart. This classic buy signal occurs when the short moving average crosses above the long term moving average, suggesting that upward momentum is [...]

The EURAUD currency pair has encountered a significant resistance level, failing to break above the critical 61% Fibonacci retracement level. This suggests that bullish momentum is weakening, reinforcing the case for a potential downward move. Given this technical setup, we favor entering a [...]

The UK100 is experiencing a remarkable rally! Over the past few weeks, the British stock market index has surged nearly 800 points. Each minor dip has attracted more buyers, fueling the bullish momentum. However, since last week, we’ve observed a slight [...]
