The price action of gold managed to penetrate above the psychologically significant resistance level at 1800.00 towards the end of last week's trading session. It remains to be seen whether the price action would manage to remain above this crucial threshold or a potential reversal would signal the beginning of a new downtrend.
The reason for the bullish spike above this make-it-or-break-it point were FED Chair Jerome Powell's remarks at the Jackson Hole Symposium. Powell did not hint at a potential FED tapering, as was expected, and instead insisted on maintaining FED's composure and patience.
The Chairman of the Federal Reserve argued that despite the high inflation rates that are currently being observed, prices' appreciation continues to be owing to persisting supply bottlenecks. Powell does not see such temporary causes of heightened inflation as being pressing enough to necessitate premature policy tightening.
FED's dovishness generally spells more troubles ahead for the struggling dollar, which, in turn, represents good news for gold bulls in the medium term. That is so because of the inverse relationship between the greenback and the precious metal.
While the longer-term fundamentals look prevailingly bullish, the short term outlook for the price of gold differs. The expectations for another robust non-farm payrolls report in the U.S. are likely to prompt a temporary dollar recovery by the end of the week. Consequently, the price of gold may be due for another minor correction.
All of this means that gold bears may have an opportunity to utilise contrarian trading strategies in the short term, whereas bulls have a chance to implement trend continuation strategies with a view on the longer term.
Examining the Attempted Breakout
The significance of last week's upswing is shown on the daily chart below. The price action broke out above the descending trend line (in black) and the psychological resistance at 1800.00. Presently, the price action is probing the 100-day MA (in blue) and the 38.2 per cent Fibonacci retracement level at 1824.89. The latter represents the most likely starting point for a new correction.
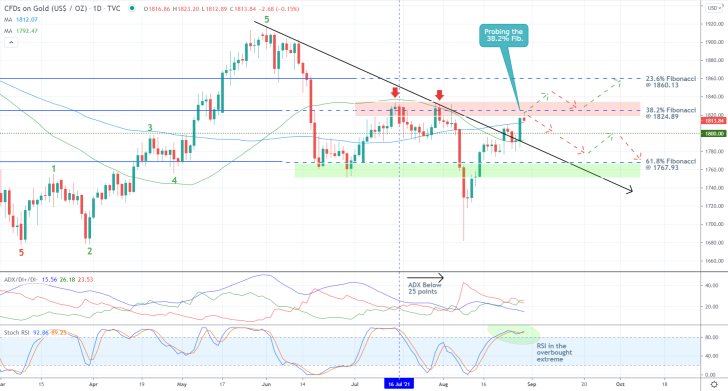
The expectations for a bearish reversal are further substantiated by the fact that the price action is probing the major Resistance Area (in red), which bears historic importance. As can be seen, this area has already prompted two reversals in the past, which gives credence to the expectations for the formation of a third one in the near future.
An eventual breakout above the 38.2 per cent Fibonacci, followed by a potential throwback to 1824.89 from above, could then lead to a continuation of the bullish trend towards the 23.6 per cent Fibonacci at 1860.13. This is the longer-term bullish target.
However, the situation looks different in the short term, as mentioned above. The ADX indicator has been threading below the 25-point mark since the 16th of July, which means that the market is currently technically range-trading.
Under these conditions, rebounds and reversals from major levels of support and resistance are more likely. This is especially important given the fact that the Stochastic RSI indicator is currently threading in its overbought extreme, which is likely to prompt the execution of multiple selling orders around the current spot price.
Timing the Correction
The latest upswing is represented as a regression channel, as can be seen on the 4H chart below. Notice that the price action is currently consolidating just below the 500-day MA (in purple) and the 38.2 per cent Fibonacci, but above the middle line of the channel and the 400-day MA (in orange).
This behaviour of the price action indicates the emergence of a very narrow bottleneck. Once the price action breaks down below the two lower limits of the bottleneck, this would likely signify the beginning of the correction. In other words, bears should be on the lookout for such developments in the very near future.
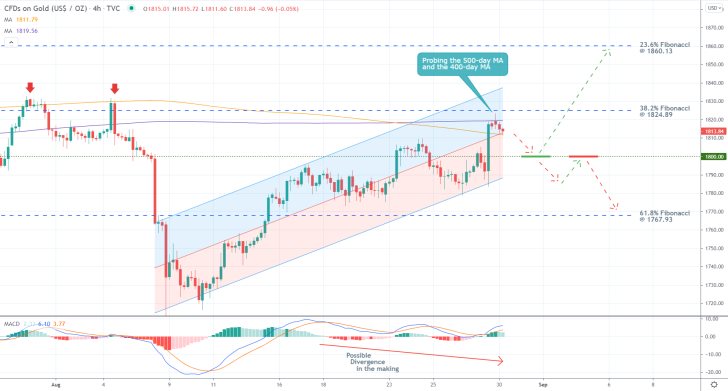
This is further substantiated by the fact that the MACD indicator is currently underpinning a Divergence in the making. Divergences signify waning bullish momentum, which is likely to be followed by a bearish reversal.
Unsurprisingly, the psychological resistance-turned-support at 1800.00 serves as the first target for the correction. This is where bears could consider collecting their running profits, while bulls could look for an opportunity to go long and join the existing uptrend.
However, they should be cautious. A potential breakdown below 1800.00 could mean that the correction would then be extended lower, likely to the 61.8 per cent Fibonacci at 1767.93. In this scenario, bears would be able to add to their selling orders once the price action establishes a pullback to 1800.00 from below.
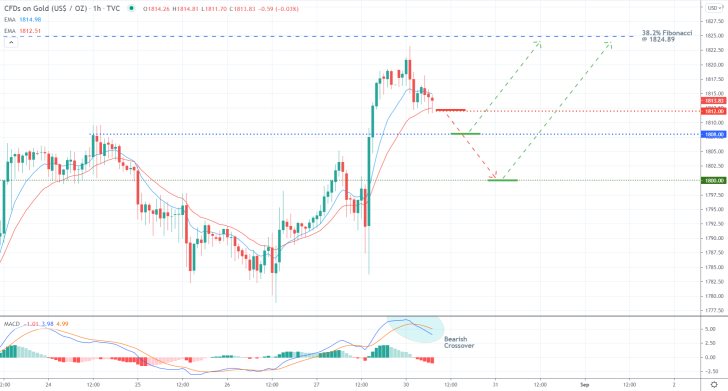
The hourly chart below demonstrates the levels that need to be considered by bears looking to enter short around the current spot price. Those include the minor support at 1812.00, underpinned by the 20-day EMA (in red), and the previous swing peak at 1808.00.
While the MACD indicator has recently registered a bearish crossover in the underlying momentum, bears should keep in mind that contrarian trading strategies entail a higher degree of risk than trend continuation ones. That is why the underlying setup is not suitable for more risk-averse bears.
Concluding Remarks
Bears should consider entering short on the condition that the price action manages to close below 1812.00 decisively. They can place their stop-loss orders just above the minor resistance level at 1815.00, which is underpinned by the 10-day EMA (in blue).
As stated earlier, the first target for the correction is represented by the psychological support at 1800.00. Yet, bears can substitute their fixed stop orders for floating TPs once the price reaches this major support. That way, they would be able to squeeze the maximum out of the correction should it manage to penetrate below this threshold.
Bulls, in contrast, can consider going long if the price rebounds either from 1800.00 or 1808.00 decisively. They should not place their stop-losses more than $10 away from their initial entries, either.
The Price of Gold Probing the Consolidation Range
The price of gold continues to consolidate in a narrow range on top of the recent upswing. The muted price action as of late is owing to the relatively uneventful week so far. However, the highly anticipated U.S. non-farm payrolls would likely jolt the deadlock.
Later today, the Bureau of Labour Statistics (BLS) is scheduled to post the latest edition of the labour force survey. According to the preliminary forecasts, the unemployment rate is expected to decrease to 5.2 per cent, the lowest level since the pandemic's beginning.
If these projections for another robust employment report are met, this would likely catalyse a short term recovery of the dollar. Conversely, the underlying woes of the greenback would be exacerbated if the employment numbers fell short of the forecasts.
In the first case, this would likely have a negative impact on the price of gold. In the second, the opposite is true. That is why the underlying setup is suitable for reactive trading, following the release of the August non-farm payrolls.
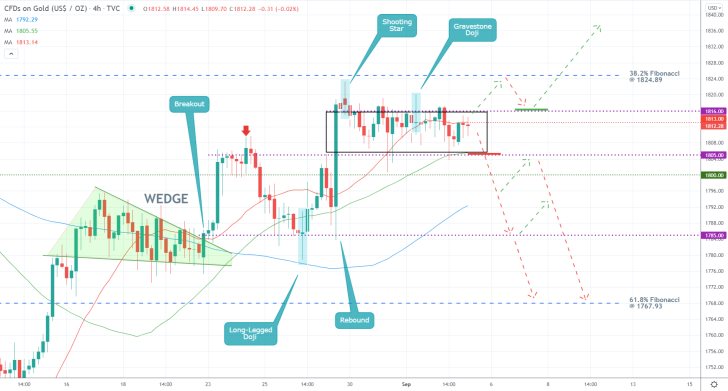
As can be seen on the 4H chart above, the price action is currently consolidating in a range between the 1816.00 resistance and 1805.00 support. The 38.2 per cent Fibonacci retracement level at 1824.89 is positioned close to the former, while the psychologically significant support at 1800.00 is just below the latter.
This means that a decisive breakout/breakdown would require a lot of commitment in either direction, which is why traders need to prepare for a lot of adverse fluctuations while the price action remains concentrated between the two extremes.
Bulls need to pay attention to the 1816.00 resistance and the fact that its prominence was established by two distinctly bearish candles - a Shooting Star and Gravestone Doji. That is why they should consider entering long only on the condition that the price action strengthens above the major resistance.
They can do so on the next throwback to 1816.00 from the 38.2 per cent Fibonacci. Bulls can then use the 20-day MA (in red) as a benchmark for their stop-loss orders.
Bears, in contrast, can consider entering short around the current spot price; however, that would entail a very high degree of risk. Part of that risk stems from the nature of proactive trading. That is why, as mentioned above, they can wait for the release of the NFP before they enter the market.
If the price breaks down below 1805.00, which was the last swing peak and is currently converging with the 50-day MA (in green), that will give them more reasons to expect likely continuation of the downtrend.
Their first target is encapsulated by the support level at 1785.00. Its significance was established following the breakout above the Wedge. Afterwards, the emergence of a Long-Legged Doji at the same level underpinned its new role as a major support.
The deeper target is the 61.8 per cent Fibonacci at 1767.93.
Chance for Gold Bears to Join the New Downtrend
The price of gold is currently in the process of establishing a new downtrend. The initial impulse leg is now seemingly completed, which means that a minor bullish pullback is likely to ensue next. This would consequently allow bears to join the new downtrend by selling at the peak of this pullback. In other words, the underlying setup looks suitable for the implementation of trend continuation trading strategies.
This week's mostly uneventful economic calendar is causing diminished trading activity, which, in turn, results in subdued liquidity. This type of market environment is well-suited to support such changes in the general direction of the market.
The last factor that warrants closer attention is the pace of global recovery. Both Japan and Australia have recently reported faster-than-expected growth over the second quarter. These results are having a positive impact on investors' confidence, which, in turn, staves off demand for safe-havens.
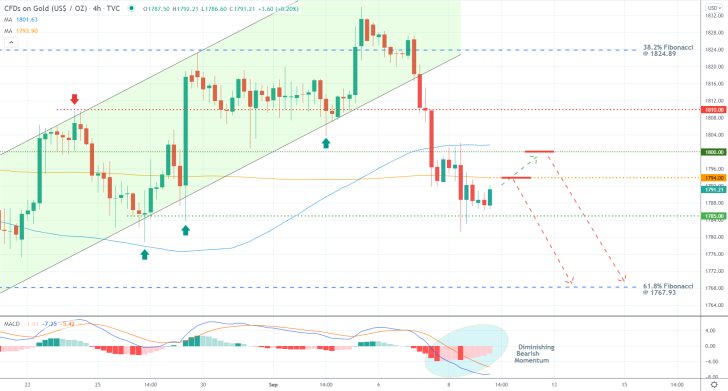
As can be seen on the 4H chart above, the new downtrend started after the price action managed to break down below the lower boundary of the ascending channel. It is currently contained within a temporary consolidation range spanning between the major support level at 1785.00 and the major resistance at 1810.00. The psychologically significant resistance level at 1800.00 is positioned between the two.
The initial impulse leg of the new downtrend seemingly bottomed out at the lower limit of the range, which served as the last swing low. That is why a minor pullback is expected to occur next. This assertion is further bolstered by the underlying bearish momentum decreasing in the short term, as underpinned by the MACD indicator.
The question is whether the pullback is more likely to peak at the minor resistance level at 1794.00, which is underpinned by the 200-day MA (in orange), or the psychological support-turned-resistance at 1800.00. Depending on their level of risk aversion, bears can look for an opportunity to sell at either one of them.
They should not place their stop-loss levels more than $7 away from their initial entries. Moreover, bears should keep in mind that potentially bigger adverse fluctuations could reach 1810.00 before the broader downtrend can be resumed. That is why bears may have to execute several orders before they gain favourable entry.
The first target for the renewed downtrend is encapsulated by the 61.8 per cent Fibonacci retracement level at 1767.93.
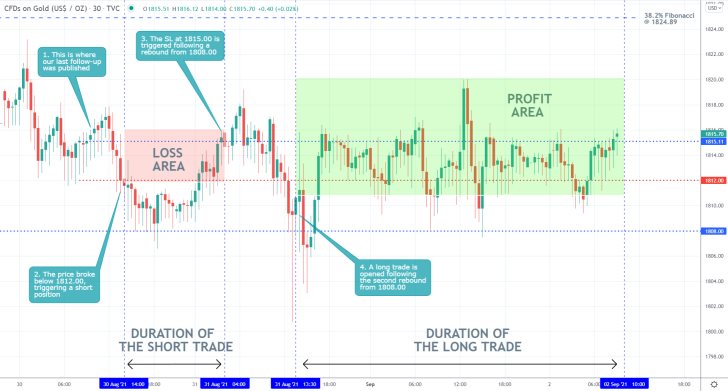
- Shortly after the publication of our last analysis of gold, the price action started consolidating in a narrow range. The price fluctuated between several critical supports and resistances, initially triggering a short order, followed by a long position.
- The price could not penetrate below 1808.00 decisively, and the first rebound from the support triggered the SL of the short position. However, the second rebound from the same support level prompted the execution of a long trade, which is so far turning profitable.
- Given that the long position was placed on the expectations for continued price appreciation, and the market is instead consolidating, the position is closed early.
- Sometimes, even if your trade is generating small running profits, it is better to close it early if the underlying market sentiment does not correspond to your initial expectations.
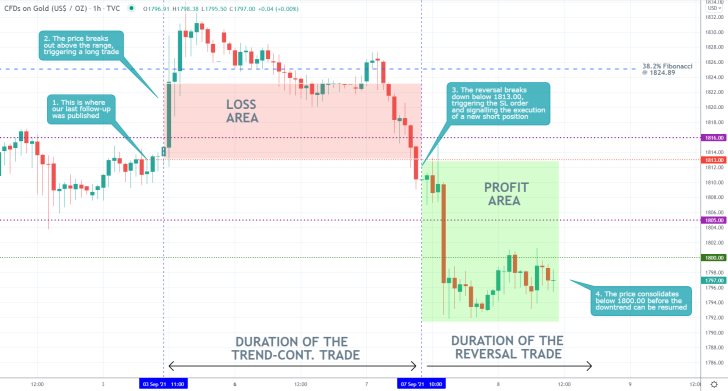
- Following the release of our last follow-up analysis of gold, the price action broke out above the consolidation range. This prompted the execution of a long order.
- However, the price action then reversed its direction, falling below the 200-day MA (in orange). This triggered the SL of the trade, but it also signalled the execution of a new short order.
- The current consolidation of the price action below the psychologically significant support-turned-resistance level at 1800.00 indicates that the price action is likely to resume depreciating as bearish sentiment keeps mounting.
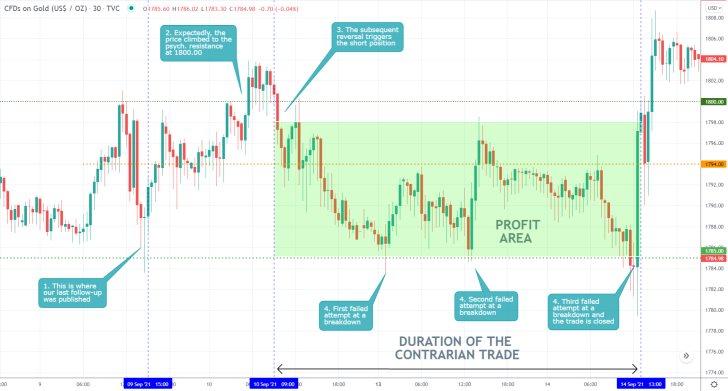
- Despite the good prospects for success, our last follow-up analysis of gold did not yield any significant results because the price action remained concentrated within the existing consolidation range. Shortly after its publication, the price action expectedly reached the psychologically significant resistance level at 1800.00 before it reversed itself.
- This triggered the selling order; however, the price action could not break down below the 1785.00 support on three separate occasions.
- This is a good example of why traders better implement floating stop orders under range-trading conditions. That way, they can protect themselves against such sudden changes in the direction of the price action.
Disclaimer: Your capital is at risk! Trading and investing on the financial markets carries a significant risk of loss. Each material, shown on this website, is provided for educational purposes only. A perfect, 100% accurate method of analysis does not exist. If you make a decision to trade or invest, based on the information from this website, you will be doing it at your own risk. Under no circumstances is Trendsharks responsible for any capital losses or damages you might suffer, while using the company’s products and services. For more information read our Terms & Conditions and Risk Disclaimer.


