The biggest bank in the U.S. is scheduled to release quarterly earnings data for Q4 of 2020 today before the market open. JPMorgan Chase's stock currently finds itself on an 8-days long bullish run ahead of today's numbers, which begs the question of just how much longer could this run be extended before a correction takes place?
The consensus market forecasts expect JPMorgan to deliver Earnings Per Share of $2.72, which would exceed marginally the $2.57 EPS that were reported for the same period a year earlier. These forecasts for solid trading revenue growth are based on the fact that trading activity picked up significantly over the second part of 2020, which affected the bank's business operations positively. This process correlated to higher prices in December, driven by higher rates of spending and investment in the U.S.
Nevertheless, JPMorgan's quarterly performance is threatened by the worsening epidemic at that time, in conjunction with the worse-off employment conditions that were observed in December. Moreover, the biggest impediment for the company's revenue growth are the low yields in the U.S., which have had such a devastating impact on the greenback in the latter part of 2020.
Overall, strong EPS data today would very likely support the continuation of JPMorgan's bullish run. However, traders should focus mostly on one particular aspect of the earnings report - the yearly revenue growth. If it is shown that the bank has suffered more than initially thought from the coronavirus fallout in the form of markedly reduced revenue streams, this is very probably going to result in a more sizable correction of the share price.
1. Long-Term Outlook:
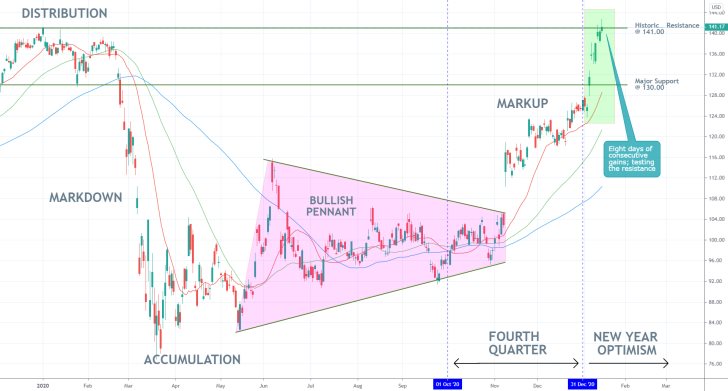
The anticipated surge in volatility following the earnings report's release would serve as a catalyst for the next direction of JPM's share price. As can be seen on the daily chart below, the price action is currently testing the upper boundary of the previous Distribution range.
The Distribution itself, which spans between the historic resistance at 141.00 and the psychologically significant support at 130.00, developed shortly before the coronavirus crash. The first major aspect of the price action's behaviour that is worth examining is that it is trying to break out above this major barrier and into uncharted territory. In other words, this seems like the perfect time and place for the emergence of a minor bearish correction, despite the strong bullish bias.
Notice also that JPM's share price's biggest advance took place in the fourth quarter, which means that this period was quite good for the company. Hence, a solid EPS report seems more likely. What is even more interesting, however, is the beginning of 2021. Every single trading day since then has been marked by stock price gains, which manifests the market seasonality factor that we emphasised on in December.

In short, the massive upswing that was generated over the past eight trading days is partly due to heightened optimism amongst traders, and not necessarily because of any intrinsic reasons. Bearish pullbacks are more likely to occur following such stretches of general market excitement. Given the current position of the price action near this historic resistance, the emergence of such a pullback/correction thus seems highly probable.
Finally, owing to the fact that the price action has been rising for eight consecutive days, the development of at least a minor correction seems probable, even if one disregards the other factors. This assertion is held true even in spite of the perfect ascending order of the three moving averages - the price action being concentrated above the 20-day MA (in red), which is trading above the 50-day MA (in green), which is positioned above the 100-day MA (in blue).
2. Short-Term Outlook:
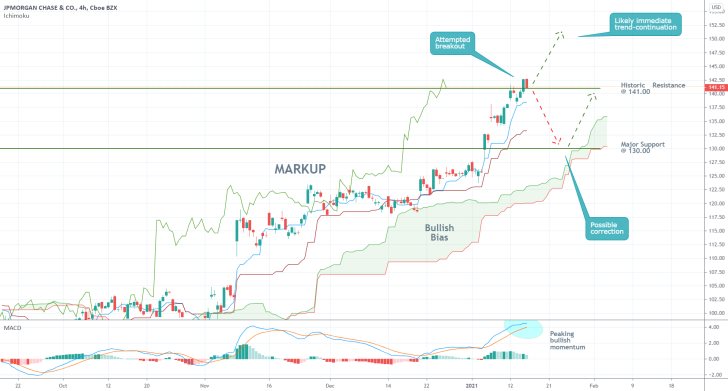
While the underlying market sentiment remains ostensibly bullish, as shown on the 4H chart below, there are reasons to doubt the likelihood of an uninterrupted continuation of the uptrend. The price action is testing the historic resistance at 141.00 for the first time since before the coronavirus crash, which in itself is a strong enough reason to cause erratic fluctuations around the current market price. Such an environment would be favourable for the establishment of a minor bearish correction in the uptrend.
The deepest that such a dropdown is likely to sink to is the major support level at 130.00 (the lower boundary of the Distribution) before the bulls regain control. This is where the Ichimoku Cloud, which serves as a floating support in a bullish market, is currently positioned at. Meanwhile, the Ichimoku Cloud indicator itself continues to exhibit the aforementioned bullish bias in the market.

In spite of all of the above-mentioned factors, however, contrarian traders should not fully discount the possibility of a continued price appreciation. Such a turn of events can be prompted in case of an especially robust earnings report later today.
It should also be mentioned that the MACD indicator continues to underscore mounting bullish momentum, albeit near a peak. This could be changed promptly if the price action establishes a new pullback.
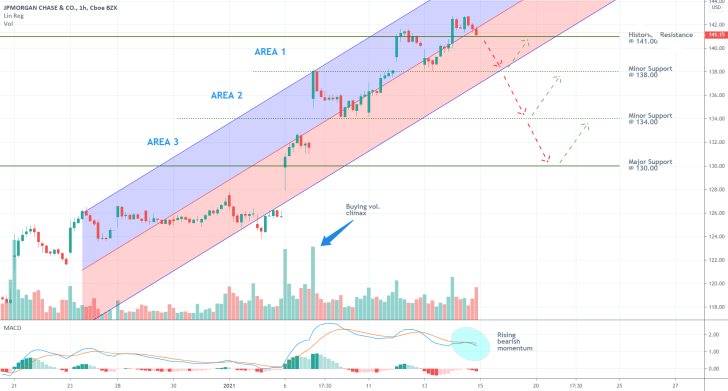
The hourly chart below demonstrates that the underlying buying volume has already peaked, and bearish momentum has started rising in the short-term. The chart also underpins three distinct areas, to which a likely dropdown could potentially fall.
The minor support at 138.00 is the nearest and most plausible target-level. That is so because it currently coincides with the lower boundary of the regression channel. However, if the reported company revenue is worse than expected, the price action could sink to either of the two lower boundaries of Area 2 or Area 3. The minor support levels at 134.00 and the psychological barrier at 130.00, respectively.

3. Concluding Remarks:
There are pretty solid indications to suggest an imminent bearish correction might be due; however, contrarian traders should consider several major points. The market is very likely to open with a massive gap today because of the earnings report, which could prompt adverse fluctuations as a result. That is why more risk-averse traders are advised to wait for this volatility to subside before they place any orders.
Moreover, it should not be forgotten that JPMorgan's shares find themselves in a really strong uptrend so that contrarian trading would entail a high degree of risk. To hedge against it, traders can instead wait for the correction to bottom out before they utilise trend-continuation trading strategies.

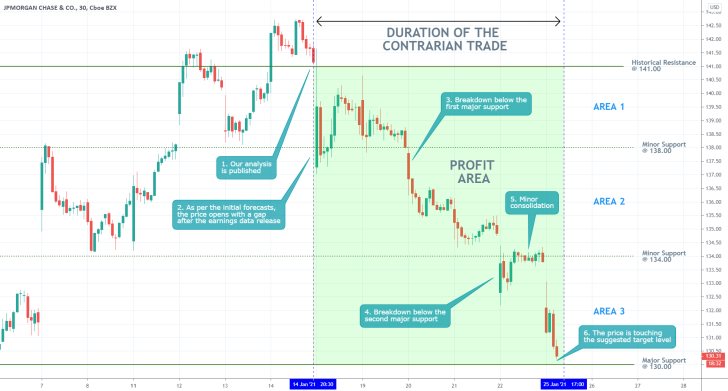
- A massively successful setup for contrarian trading on JPMorgan's earnings report. As expected, the share price opened with a gap after the release of the earnings data, which led to the development of a significant bearish correction. The latter moved by $11 in our anticipated direction.
- The analysis properly assessed the high degree of risk associated with such contrarian trading. Even still, the opportunity was utilised because of the confluence of the underlying evidence. Remember, the best trades are executed when all pieces of available evidence point in the same direction; but even in such cases, there is always the possibility of sudden changes in the market sentiment. That is why it is so important to utilise tight risk management.
Disclaimer: Your capital is at risk! Trading and investing on the financial markets carries a significant risk of loss. Each material, shown on this website, is provided for educational purposes only. A perfect, 100% accurate method of analysis does not exist. If you make a decision to trade or invest, based on the information from this website, you will be doing it at your own risk. Under no circumstances is Trendsharks responsible for any capital losses or damages you might suffer, while using the company’s products and services. For more information read our Terms & Conditions and Risk Disclaimer.


