The GBPUSD is still summiting near the peak of its recent rally, and traders wonder whether the cable has enough strength left to continue climbing. The continuation of the rally would be subject to whether the currently developing swing high manages to surpass the previous one. And the fact that the price action is presently probing a psychologically significant resistance raises the stakes even more.
Meanwhile, if the price action were to change directions suddenly, there is a high probability that this will demonstrate a forthcoming downtrend. Such a reversal will underpin the emergence of a Dead Cat Bounce, which is a pattern that typically signifies the likely creation of such bearish trends.
The present week is filled with top-tier events and economic releases in both the U.S. and U.K., which look poised to stir heightened volatility on the GBPUSD. The dollar continues to strengthen as the U.S. economy recuperates, in line with the concomitant fiscal and monetary policies in the U.S. On the other hand, the sterling bulls also remain hawkish, given the better-than-expected recovery prospects.
The brewing 'battle of expectations' juxtaposes greenback bulls against sterling bulls, and one of the two will assuredly be disappointed. This environment constitutes a make-it-or-break-it point in the market, the type of which is commonly found prior to the advent of a massive price swing.
In other words, the GBPUSD appears to be establishing a bottleneck, which is likely to be followed by a new price trend. That is why it is worth exploring the recent behaviour of the price action in a bid to prepare for when the GBPUSD is ready to begin developing such a trend.
1. Long-Term Outlook:
As shown on the daily chart below, the GBPUSD recently concluded establishing a major 1-5 impulse wave pattern (in green), as postulated by the Elliott Wave Theory. This presupposes the likely exhaustion of the underlying bullish sentiment, which is now likely to be followed by increased bearish pressure. This is further substantiated by the fact that the last impulse leg of the pattern (4-5) constitutes a minor 1-5 pattern itself, which is also completed.
Such 1-5 impulse wave patterns are typically followed by Elliott ABC corrections, which is why the creation of a bearish pullback seems like the next most likely development for the GBPUSD. The subsequent bearish correction is expected to target the 23.6 per cent Fibonacci retracement level at 1.35765, which represents the nearest most significant target. In addition to having intrinsic value as a Fibonacci retracement, the level also gains prominence from its previous role as a swing high at point 3. It is also currently converging with the 100-day MA (in blue), making it an even more crucially important barrier.
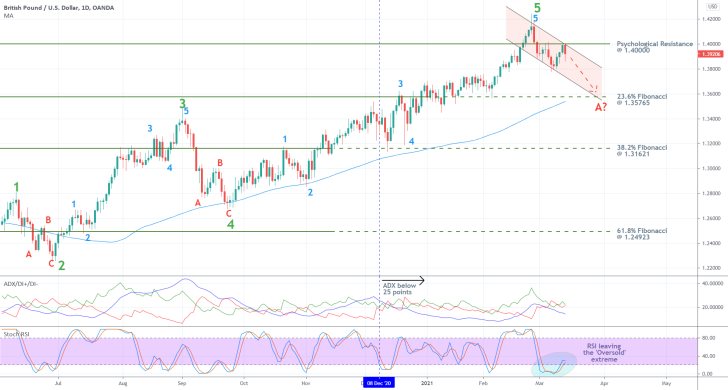
Notice that the price action is currently probing the psychological resistance at 1.40000, which is itself a major make-it-or-break-it point. Bulls will want to see whether the GBPUSD manages to shoot above it, in which case the pair will be able to attempt climbing past the previous peak at point 5. Such a turn of events would invalidate the underlying bearish forecasts. In contrast, a possible rebound from 1.40000 would substantiate these bearish expectations, as the price action remains concentrated within the boundaries of the descending channel.
The ADX indicator has been threading below the 25-point benchmark since the 8th of December, which means that the GBPUSD is technically ranging at present. This type of market sentiment represents a suitable catalyst for inducing abrupt changes in the underlying price's direction, which is good news for bears.
Meanwhile, the Stochastic RSI indicator is currently threading in its 'Oversold' extreme, which presupposes a likely increase of buying pressure in the short-term. This shouldn`t be disregarded by bears looking to enter short at the current market price.
2. Short-Term Outlook:
The 4H chart below examines the recent behaviour of the price action under the EWT in greater detail. It underpins an even smaller Elliott cycle (in orange), which has already formed an ABC correction. This can be used to draw an intermediate range spanning between the psychological resistance at 1.40000 and the minor support at 1.38500. The eventual breakout/down of the price action away from the range's boundaries will underpin its next most likely direction.
The significance of the range is further bolstered by the fact that its lower boundary currently converges with the 200-day MA (in purple), whereas its upper boundary is positioned near the 100-day MA. Any rebound from either of the three moving averages, including the 50-day MA (in green), will represent a major directional signal.
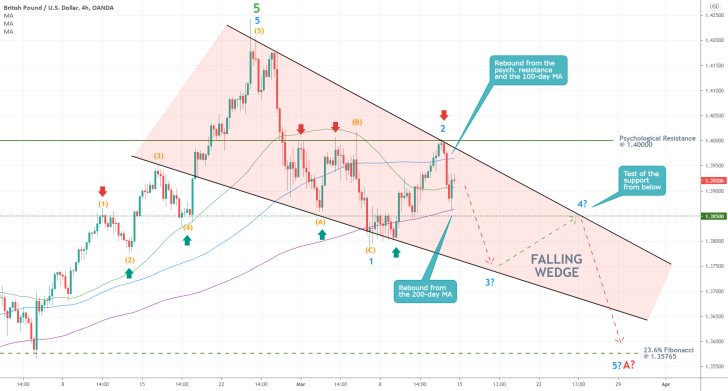
The aforementioned expectations for the emergence of an ABC correction from the 1-5 pattern (in green) are represented as a minor 1-5 pattern (in blue) that is currently developing. If the price action remains on its current course, its next target will be the establishment of a swing low at point 3 (the second impulse leg 2-3), which is likely to occur near the Falling Wedge's lower border. Afterwards, the retracement leg (3-4) could constitute a bullish pullback to the 1.38500 level (as well as to the 200-day MA) from below. The final impulse leg (4-5) will then probably attempt to break lower towards the 23.6 Fibonacci retracement.
Keep in mind that at any point, a decisive breakout above 1.40000 (as well as above the Falling Wedge's upper limit) would invalidate these projections.
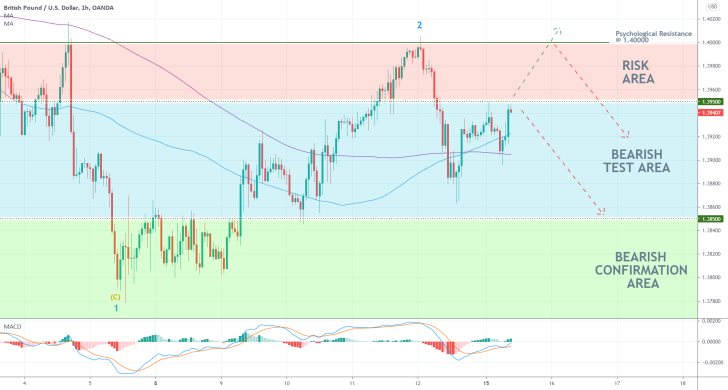
The hourly chart below examines the underlying trading opportunity for market bears. Three crucially important areas are drawn, and the behaviour of the price action within each one of them should be monitored especially carefully.
The Risk Area underpins the threat from the price action attempting another breakout past 1.40000, which elucidates the risk of premature selling. Meanwhile, a bearish rebound from either the psychological resistance or the Bearish Test Area's upper boundary (at 1.39500) will confirm the underlying expectations for the emergence of another correction. Finally, a dropdown to the Bearish Confirmation Area will further substantiate these expectations.
3. Concluding Remarks:
For the time being, bears should remain cautious of the mounting bullish momentum in the short-term, as underpinned by the MACD indicator on the hourly chart above. Ideally, they need to enter short at the next swing high, presumably somewhere within the Risk Area's boundaries, by utilising contrarian trading strategies. Those entail a high degree of risk, which is something that more risk-averse traders need to consider carefully.
As stated earlier, a potential breakout above 1.40000 would invalidate those expectations, which, in turn, is something that bears can use as a marker for placing their SLs. However, any retracement below 1.40000 would reinstate the bearish opportunity.
Finally, the long-term goal for such a bearish correction is encompassed by the 23.6 per cent Fibonacci retracement level.
GBPUSD's Pennant to Signal the Next Direction for the Cable
The GBPUSD continues to send mixed signals to traders owing to the many economic events and releases that were posted this week. On the one hand, FED's policy meeting on Wednesday highlighted the still overwhelmingly dovish stance of the FOMC, which helped the greenback strengthen but not as much as initially expected.
The greenback continues to be recuperating, driven by the robust recovery that is being achieved in the U.S.; however, this trend is still far from becoming decisive. The greenback is not yet overtaking other currencies, despite this heightened optimism.
On the other hand, the monetary policy meeting of BOE's MP Committee from yesterday met all initial expectations. In doing so, the pound was not propelled in either direction. Instead, it continues to hold out against the greenback, with no strong bias currently being observed to affect the cable's underlying direction.
Unsurprisingly, this mostly neutral market sentiment is causing the GBPUSD to act indeterminately at present. Consequently, this behaviour of the price action is forcing the pair to develop a 'bottleneck' of sorts, which is then likely to be followed by an eventual breakout/down. That is why it is worthwhile examining the temporary consolidation of the underlying price action to prepare for this eventual spike.
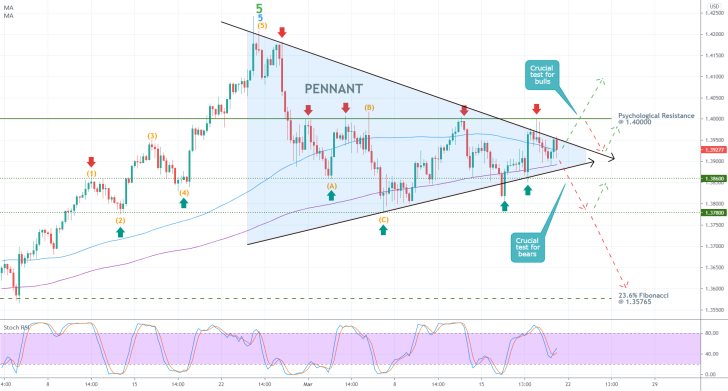
As can be seen on the 4H chart above, the aforementioned consolidation is currently taking the form of a major Pennant pattern. Whenever such a pattern emerges in an established uptrend, this is commonly taken to signify a likely trend-continuation. In other words, GBPUSD bulls would be looking for signs of a decisive breakout past the Pennant's upper boundary, which can confirm these expectations.
The fact that the underlying price action has already tested and failed to break down below the 200-day MA (in purple) on two separate occasions indicates that there is robust bullish pushback from this floating support. However, the price action has also failed to break out above the psychologically significant resistance level at 1.40000 on five separate occasions.
This means that the significant trend-continuation indication that market bulls would be looking for would be elucidated by a decisive breakout above this psychological barrier. Opening any long orders beforehand will thus entail considerable risk, namely, from the possibility for the formation of more such bearish rebounds from 1.40000.
In contrast, bears will be looking for signs of a breakdown below the Pennant's lower boundary. Those will entail a decisive penetration below the 200-day MA (without subsequent rebounds) and the major support level at 1.38600. If such a breakdown does form in the near future, bears will be justified in placing short orders on the expectations for additional dropdowns afterwards. Should the price action manage to break the major support level at 1.37800 (last swing low) as well, then the next target for the renewed bearish trend would be the 23.6 per cent Fibonacci retracement level at 1.35765.
Both bears and bulls can monitor the reading of the Stochastic RSI indicator in the near future in order to protect themselves against the possibility of more adverse fluctuations. Those can continue to emerge for as long as the price action continues to consolidate, and the bottleneck becomes increasingly narrower.
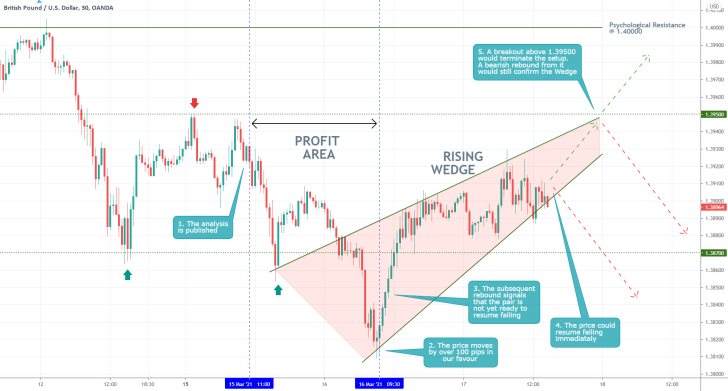
- Shortly following the last GBPUSD analysis' release, the price action started falling, as per the forecasts of the analysis. At one point, the price action had moved by over 100 pips in favour of the analysis (reaching the Bearish Confirmation Area) before retracing back.
- This retracement back within the boundaries of the Bearish Test Area signalled that the market was not yet fully ready to commit to establishing a broader downtrend. Nevertheless, the price action went on to start establishing a Rising Wedge pattern, which signifies the likely continuation of the downtrend in the near future.
- However, if the price action breaks out above 1.39500, this would imply the termination of the selling opportunity for the time being.
- The biggest takeaway from this is that traders would do well to utilise floating TPs and SLs to protect themselves against such sudden changes in the direction of the underlying price action.
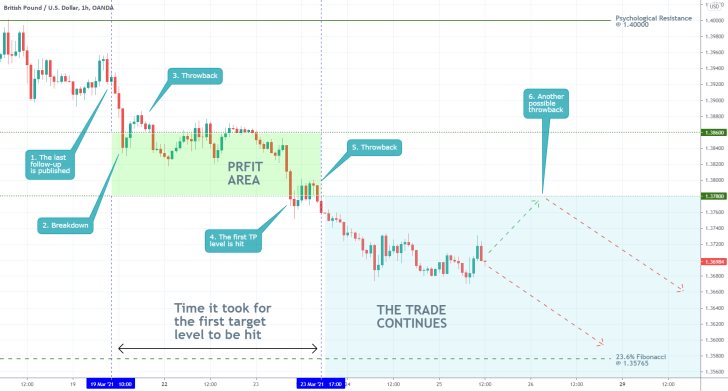
- The expectations of the last follow-up started to get realised after the GBPUSD broke down below the Pennant. The currently emerging downtrend hit the first target level (at 1.37800) and is now headed towards the next target (the 23.6 per cent Fibonacci retracement level).
- Bears should keep in mind that an intermittent throwback could test the 1.37800 level (now as a resistance) before the broader downtrend is resumed. If this possibility is realised, bears would be able to sell at the resulting peak. However, if the price action breaks out above that resistance decidedly, this would terminate the entire setup.
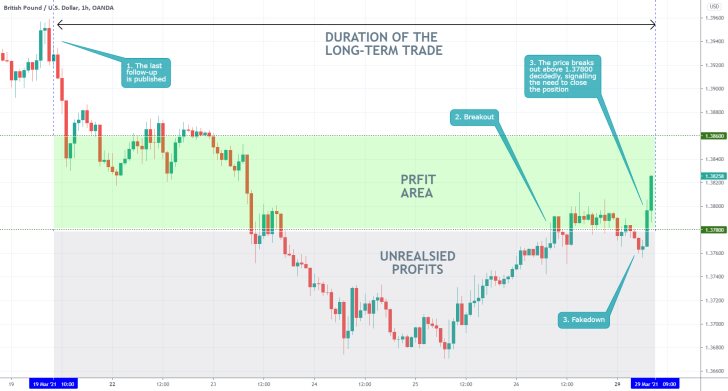
- Even though the GBPUSD had made significant headway in reaching the target level presented by the last follow-up, the bullish rebound is now clear. The decisive breakout above the 1.37800 resistance level confirmed the completion of the trade.
- The biggest takeaway here is the need to use floating stop-losses/profits whenever aiming for faraway targets. Those would ensure the underlying position remains protected against such sudden reversals.
Disclaimer: Your capital is at risk! Trading and investing on the financial markets carries a significant risk of loss. Each material, shown on this website, is provided for educational purposes only. A perfect, 100% accurate method of analysis does not exist. If you make a decision to trade or invest, based on the information from this website, you will be doing it at your own risk. Under no circumstances is Trendsharks responsible for any capital losses or damages you might suffer, while using the company’s products and services. For more information read our Terms & Conditions and Risk Disclaimer.


