As we stressed on our materials from yesterday, the demand pressures for the US dollar are currently undergoing through profound and structural changes due to the COVID-19 pandemic. As national governments go on a full lockdown in a bid to ‘flatten the curve’ – a now popular expression of epistemologists outlining a strategy used to curtail the spread of viruses – so the general economic activity is falling everywhere.
Investors and market experts are no longer pondering on the question of whether the pandemic is going to cause a new recession, but rather of how severe it is going to be. Such deliberations create a general feeling of nervousness globally, which results in the development of these structural and profound changes to the global economic cycle.
Investors are now fleeing to liquid and easily convertible assets; whose flexibility is a great pain relief at times of economic crisis. The greenback is undoubtedly the brightest example of such an asset, as it is recognised and accepted globally.
That is the prime reason why at times when adverse uncertainty looms over the global economic prospects for growth, investors and other market participants seek the relatively safe-refuge of the US dollar. Such actions, however, are coming at a cost, as the heightened demand for the greenback is hurting emerging economies. The latter do not only have to fight with the COVID-19 epidemic locally, but they also have to face the difficulty of having to cope with a less competitive local money market globally.
Such concerns are now becoming known to policymakers worldwide, as the really high dollar is becoming an issue not only for emerging markets but also for the advanced economies, including the US. This trend could potentially result in the creation of a ticking time bomb, which could explode at any time and create a new debt bubble burst.
That is why the Trump administration, in addition to the Federal Reserve, can be anticipated to attempt to curb the further strengthening of the greenback, while accommodating the needs of the reeling American business. Based on general economic theory, heightened liquidity in the country (which is the case now) should degrade from the underlying currency’s value in time. Recently, the FED decided to increase the money supply in the country, in a bid to curtail the damaging impact of COVID-19's economic fallout. Thereby, in the long run, this policy is going to cause the greenback to depreciate. In the short term, however, the currency continues to strengthen due to the aforementioned speculative actions on the part of international investors.
In Canada, Justin Trudeau announced yesterday that the Government is going to boost its stimulus for the reeling local businesses as well. All of these conditions create a very volatile market environment for the USDCAD pair, which has registered tremendous gains over the past several days. That is why so many traders are starting to anticipate the eventual correction, which should at least momentarily bring a stop to the current bullish trend.
The primary purpose of the present analysis is to examine the pair's price action and to evaluate the likelihood for the formation of a short-term price correction over the next following days. Respectively, it is also going to consider the underlying fundamental factors and examine the possibility for the establishment of a breakout above the crucial resistance level into uncharted territory.
1. Long Term Outlook:
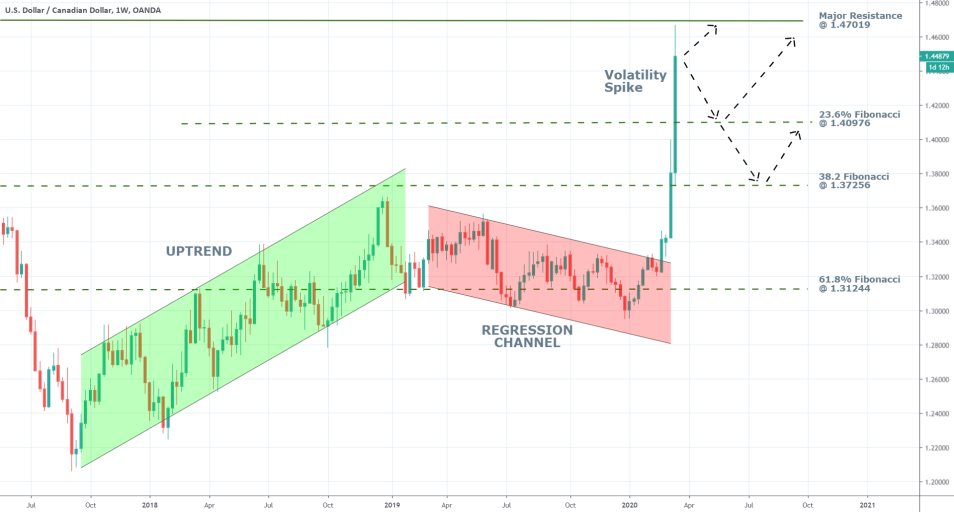
As can be seen on the weekly chart below, the USDCAD has started behaving uncharacteristically only in the last two weeks. This coincides with the time when the outbreak of the coronavirus began picking up momentum in Europe and the US. The pair is currently consolidating just below the major resistance level at 1.47019 after its price managed to break out above the 23.6 per cent Fibonacci retracement level at 1.40976 this week.
On the one hand, the massive size of the volatility spike is encouraging market bulls to believe that the momentum is likely to persist and that the pair is probably going to continue ascending with relative ease. On the other hand, the major resistance level at 1.47019 has been prevalent since January 2016. Some market bears believe that the strength of the resistance level is going to be sufficient enough to halt any further gains at least temporarily and that a new correction is likely to begin at the current market price. They see the relatively big upper shadow of the last candle as a potential early indication that the bullish momentum is losing steam in the short run.

Hence, there are two likely scenarios in which the price action is likely to develop next. The USDCAD is either going to break out above the aforementioned resistance and continue ascending further north, or it is going to bounce back from 1.47019 and form a new correction. The pair is unlikely to continue trading in a new range due to the massive underlying volatility that is currently driving the market. The market sentiment is too robust to stop affecting the price action in an instant, which is what is needed for a new range to form.
If the price does bounce back from the resistance and starts forming a new correction, it could find support either at the 23.6 per cent Fibonacci retracement at 1.40976, or the 38.2 per cent Fibonacci retracement at 1.37256. A new dip is going to be formed somewhere in that range before the broader bullish trend can continue developing.
At present, it seems unlikely for the USDCAD to break down below 1.37256, but if it does, the bearish correction is likely to transform itself into a full-blown bearish trend. For that to happen, however, the underlying fundamentals would have to change as well.
2. Closing Down the Borders While Letting the Liquidity Loose:
The sociopolitical and economic developments in the US and Canada unsurprisingly influence the price of USDCAD. The two countries have responded to the COVID-19 outbreak in North America in similar ways. The two governments have both pledged to boost their aggregate spending and to help struggling families and businesses locally, by extending cheap capital to them. Meanwhile, their central banks – the FED and BOC – have already initiated asset-purchasing programs, which serve as mechanisms for providing quick money supply for the reeling economy. The only considerable difference is the scope and range of the two countries’ economic relief packages that have been advanced so far.
Donald Trump announced yesterday that the US and Canada both agreed to close down the border between the two countries, which is so far proving to be the most substantial political response in the region to the outbreak of the novel coronavirus. It is yet uncertain whether this move, in addition to Trump’s previous decision to restrict flights from Europe for a period of 30 days, is going to have decided practical results. For the time being, these decisions seem to be serving more of an insurance purpose than anything else.
The most important conclusion that can be drawn from an observation of Trump's behaviour over the past few days is that the President has shifted his tone towards the coronavirus completely. Initially, the President's rhetoric was one of assurance, aimed at diffusing the public's tension. Recently, however, Trump appears to have changed his outlook and acknowledged the real risks from COVID-19. He is now stressing on the importance of social distancing while assuring the public that the American economy remains strong.
These surface changes in Trump's political agenda are unlikely to impact the price action on the USDCAD drastically; however, they could prove to be enough to change global investors outlook on the newest impact of COVID-19 on the global economy. It is likely for international investors to stop viewing the greenback as an all-powerful cure against the coronavirus uncertainty, which would wane the demand for the currency and likely prompt the anticipated correction in USDCAD’s price action. At any rate, the upwards volatility spike on the USDCAD is going to be terminated after investors and traders’ demand for liquid assets starts to diminish, as their outlook on the pandemic changes over time.
3. Short Term Outlook:
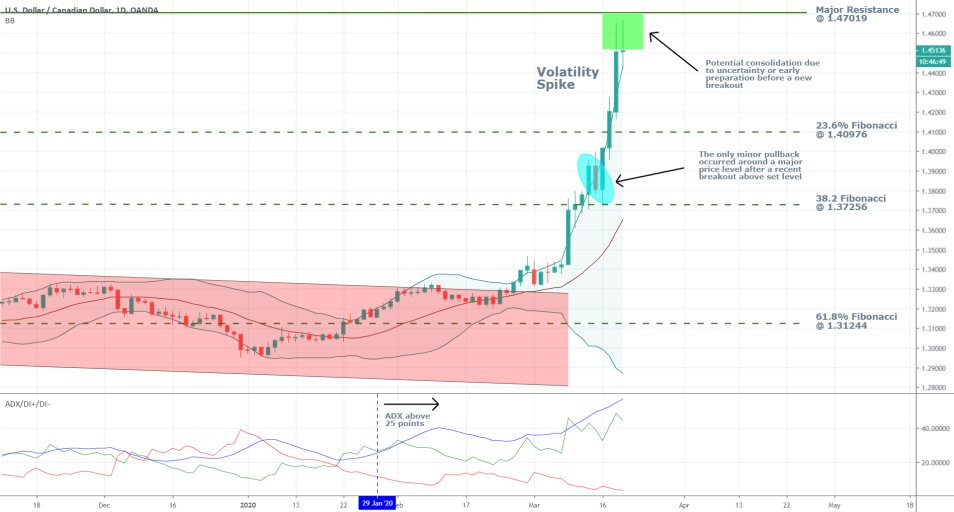
Several key considerations about the current state of the price action can be drawn from examining the daily price chart below. Firstly, the bullish trend is solid and is likely to remain so in the foreseeable future, as demonstrated by the Average Directional Index. The ADX is threading way above 25 points, which is a clue suggesting the likely persistence of the bullish volatility spike. However, it does not negate the possibility for the formation of a short-term correction.

The enormously wide Bollinger Bands exhibit the tremendous volatility which has surged following the escalation of the coronavirus situation, yet, even with this pressing uncertainty on the market, the price action is not wholly devout of logic. As can be seen, the first minor pullback has developed shortly after the pair broke out above the 38.2 per cent Fibonacci retracement level. This means that in spite of the massive volatility that currently underscores the bullish uptrend, the price action is still prone to developing common patterns around crucial levels.
The price is currently nearing one such level – the major resistance level at 1.47019 - which increases the likelihood of the formation of a new correction, or possibly a false breakout followed by a short-term consolidation around the resistance.
The long upper shadows of the candlesticks representing the last two trading days (today and Wednesday) are relatively big compared to the previous candlesticks. Even more so, the previous two days have been the first to register any signs of waning bullish commitment since the beginning of the volatility spike, judging solely by the shape and size of their shadows. Hence, the behaviour of the price action over the past two days is not decisive, and no conclusive evidence can be drawn about its future behaviour, based only on those two days. Nevertheless, this is still an early indication of waning bullish momentum in the market, and it should be regarded as such. All of this is giving the market bears more reasons to believe that the formation of a correction around the current market price is now more plausible.

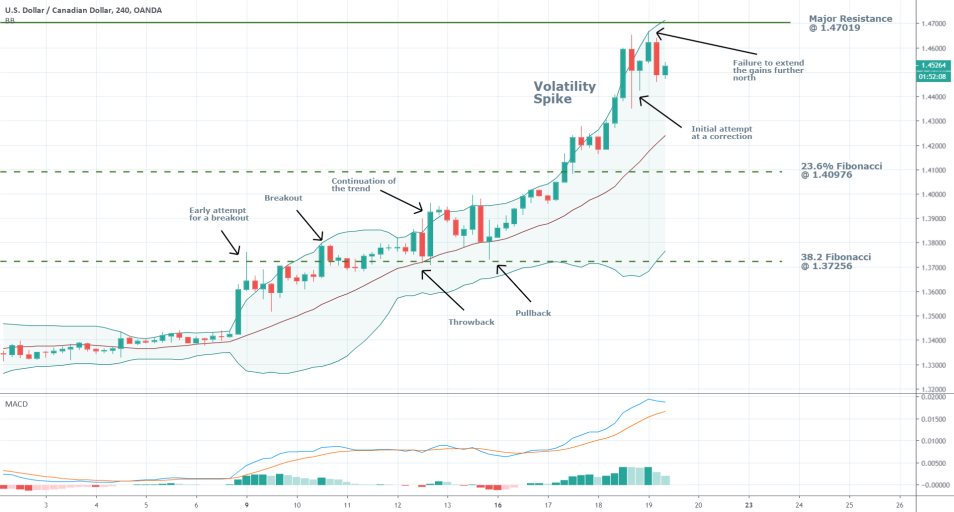
The 4H chart above further categorises the behaviour of the price action in greater details. As can be seen, the underlying bullish trend is now exhibiting behaviour that could potentially allude to the formation of a correction, for the first time since the trend began developing. The price action appears to be consolidating below the resistance in one of the longest stretches marked by no considerable gains over the last few days.
All of this, coupled with the waning bullish momentum, which is exhibited by the MACD, can be taken to signify that the USDCAD would have a difficult time ahead in forming a new major breakout.
4. Concluding Remarks:
The USDCAD appears ready to form a new correction, which would give bears an opportunity to profit from short-term contrarian trading, whereas bulls would potentially have the opportunity to add to their long orders at a discount once this potential correction forms a new dip. The anticipated correction, however, is not necessary to develop at the current market price. It is also quite possible for the current consolidation to transform itself into a new breakout if the underlying fundamental factors continue to support the bullish market.

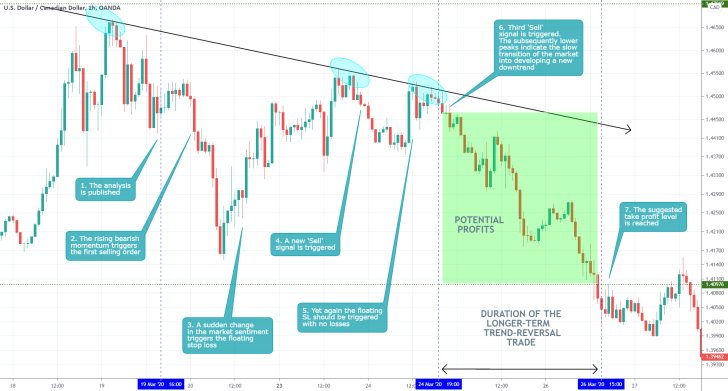
- The above scenario illustrates a perfect example of a protracted trend reversal in the market. The USDCAD was transitioning from a bullish trend into a bearish one, and the analysis aimed to catch this opportunity for contrarian trading. In order to trade such protracted changes in the underlying market sentiment, traders need to have a lot of mental stamina so that they can monitor the subtle changes in the behaviour of the price action over time. In other words, traders expecting 'quick returns' are most likely going to get extremely frustrated if they have to execute 1-2-3 or more orders before the market finally moves in their anticipated direction. Remember, trading is not about 'hitting the Bullseye', rather successful traders know that more often than not they would have to try several times before they can get the desired entry into a trade.
- Shortly after the analysis was published, the price started going south, thereby prompting the execution of the first short order. The price then came close to reaching the suggested take profit level at 1.40976, but afterwards it changed directions once again because of a sudden change in the underlying sentiment. Such seemingly random changes in the behaviour of the market at times is why traders need to monitor closely their evolving trades. Chiefly, they need to move their stop-losses to a breakeven point (or substitute them with floating SLs) after the market had already moved by a certain margin in their favour. As regards FX trading, traders can, and in fact should, move their SLs to a breakeven point after the market had already moved by more than 40-50 pips in their favour -that is especially true for longer-term trades aiming to catch several hundred pips.
Disclaimer: Your capital is at risk! Trading and investing on the financial markets carries a significant risk of loss. Each material, shown on this website, is provided for educational purposes only. A perfect, 100% accurate method of analysis does not exist. If you make a decision to trade or invest, based on the information from this website, you will be doing it at your own risk. Under no circumstances is Trendsharks responsible for any capital losses or damages you might suffer, while using the company’s products and services. For more information read our Terms & Conditions and Risk Disclaimer.


