The price of wheat is developing a new bullish trend after exiting out of a major bearish market in early-July. Wheat futures sank as low as 480.00 cents per bushel in late-June, just before the beginning of the summer harvest in Europe. According to people familiar with the matter, the harvest results in France and Britain fell short of last year's recorded performance.
Meanwhile, better-than-expected results in Germany and Poland barely managed to make up for the created gap. Even still, Reuters reports that:
"French consultancy Strategie Grains forecasts this year's soft wheat harvest in the European Union and Britain at 128 million tonnes, 13% down on 2019. In France, the EU's largest wheat producer, the crop has fallen by about 25% on 2019 to around 29-30 million tonnes, with yields damaged by spring drought and sowings reduced by torrential autumn rain."
As per usual, around the time the results started to become available, volatility was heightened as the market began discounting the longer-term implications on the underlying supply and demand equilibrium – an example of the impact of market seasonality.
At first, the price of the Mini December Futures Contracts (XWZ2020) shot up on the news that aggregate supply might fall short of last year's performance. The initial upswing was then followed by a bearish correction triggered by robust harvest numbers in Russia, which is the largest producer of wheat in the world.
Overall, the fractal nature of wheat's price action is quite evident, as it is about to be seen below. This insight can be used to project future directional movements, as the price action establishes easily discernible upswings and downswings. Therefore, the Elliott Wave Theory can be utilised to project key price levels of interest.
1. Long-Term Outlook:
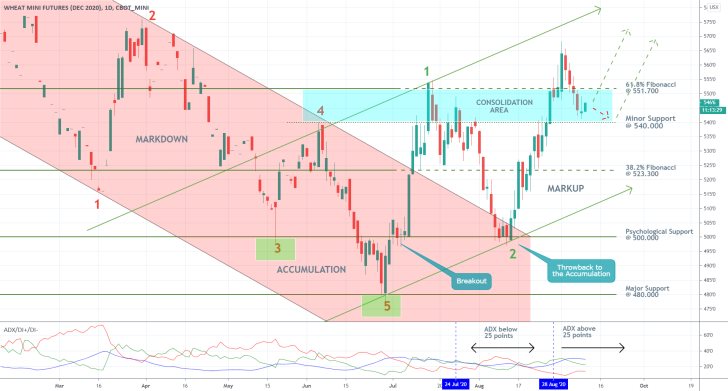
The daily chart below does a good job of demonstrating the gradual transition of the market from having an ostensibly bearish sentiment into adopting a prevailingly bullish bias. As was mentioned above, the preceding bearish market can be examined through the lenses of the Elliott Wave Theory. The broad downtrend was concluded after the termination of the bearish 1-5 impulse wave pattern.
The latter reached a dip near the major support level at 480.000, which serves as the lower boundary of an Accumulation range. It represents a transitionary stage separating the Markdown and the newly emerging Markup. Finally, the range has the psychologically significant level at 500.000 as its upper boundary.
Notice that the first retracement leg (1-2 in green) of the newly emerging bullish 1-5 impulse wave pattern reached a dip precisely at the 500.000 benchmark, which at the time converged with the upper edge of the downwards sloping channel. This throwback represents a major piece of evidence justifying the expectations for further price appreciation in the long-term.
At present, the price action is consolidating below the 61.8 per cent Fibonacci retracement level at 551.700. The latter encapsulates the upper edge of a major consolidation area, which has the minor support level at 540.000 as its lower edge. The boundaries of this consolidation area are determined by the previous behaviour of the price action around them; there are two rebounds from each level – one from the bearish point 4, and one from the bullish point 1.

In other words, the price action is likely to fluctuate within the borders of this consolidation area before any directional movements can be resumed. Keep in mind that in an extreme case, the bearish correction can fall as low as the 38.2 per cent Fibonacci retracement level at 523.300 before the market finds the necessary support to rebound and continue heading higher.
The psychologically significant resistance at 600.000 encapsulates the primary target-level for the currently developing bullish 1-5 impulse wave pattern in the long run. These assertions are supported by the fact that the market is once again trending, as demonstrated by the ADX indicator. The latter has been threading above the 25-point benchmark since the 28th of August.
2. Short-Term Outlook:
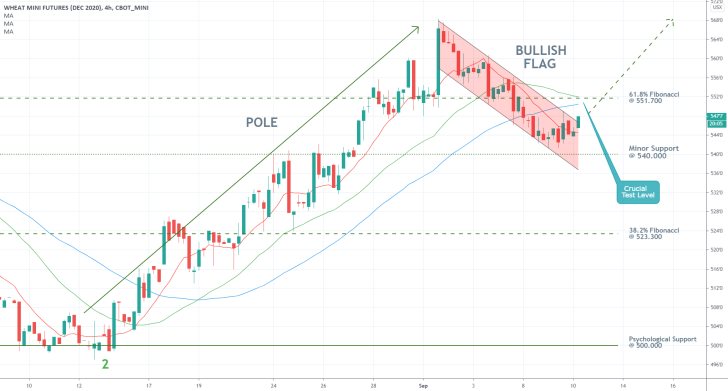
The 4H chart below illustrates the underlying opportunities for the implementation of both swing and position trading strategies. The price action is establishing a classic trend continuation setup – a bullish flag pattern, which entails the execution of long orders once the flag reaches a swing low.
The price action recently moved above the 10-day MA (in red), which is the first signal of rising bullish commitment in the market. Nevertheless, the price action would have to break out above the 61.8 per cent Fibonacci retracement before the renewed bullish bias can be definitively confirmed.
Notice that the 30-day MA (in green) and the 50-day MA (in blue) are currently converging towards the latter, which makes it an even more significant test level for bullish bias in the market. Accordingly, the possibility of a bearish rebound from the 551.700 level is relatively high.

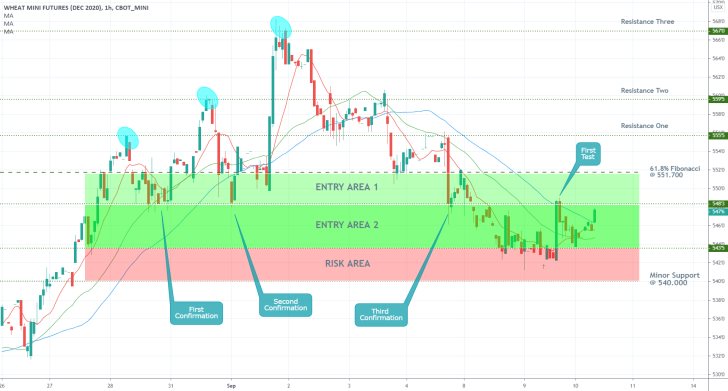
As can be seen on the hourly chart below, there are three areas of interest for trading. Entry Area 2 (in dark green) is arguably more suitable for less risk-averse swing traders who are looking to enter long as the market changes directions yet again. The price action is currently attempting to break out above the three MAs, which represents a confirmation of the rising bullish sentiment in the market. Yet, the significance of the 548.300 level has been confirmed on four distinct occasions, which represents a substantial test for the underlying bullish momentum.
Entry Area 1 (in light green) is more suitable for risk-averse position traders who are looking to place buying orders on the expectation for continued price appreciation in the long-term. The 61.8 per cent Fibonacci represents a major obstacle for both types of traders. Additionally, there are three separate resistances above the 551.700 level that could potentially disrupt the new upswing.
Meanwhile, the area in red manifests the underlying risk of continued price depreciation. Deeper stop-loss orders could be placed anywhere between the minor support at 540.00 and 543.500, while narrower stop losses (for more risk-averse traders) can be placed just below the three MAs.
The recent peak at 567.00 represents the nearest target-level suitable for swing traders, who, ideally, should eye a potential take-profit anywhere above this level. Meanwhile, position traders can use the zone around the psychological resistance at 600.000 as a preferred take-profit area for their long orders.

3. Concluding Remarks:
Wheat futures look poised to continue rising in the near future given the aforementioned fundamentals. Such expectations reflect the present supply and demand dynamics in the market. Nevertheless, the current bearish correction also can plummet further down south before the market finds support, so market bulls should be cautious not to enter long prematurely.

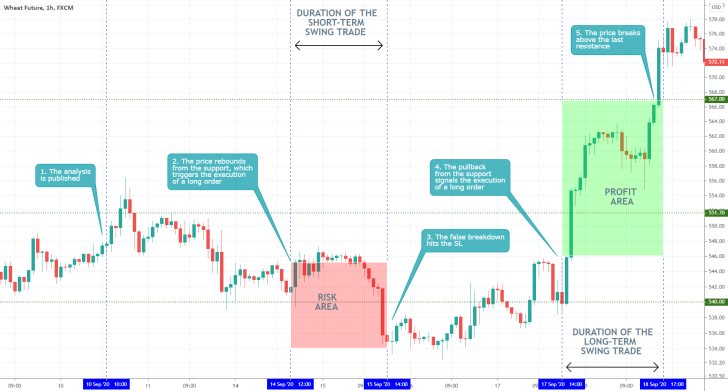
- The short-term projections of the analysis were not quite accurate, as the price action continued to depreciate following the publication of the analysis. The longer-term projections, however, were excellent, and could catch quite a massive upswing.
Disclaimer: Your capital is at risk! Trading and investing on the financial markets carries a significant risk of loss. Each material, shown on this website, is provided for educational purposes only. A perfect, 100% accurate method of analysis does not exist. If you make a decision to trade or invest, based on the information from this website, you will be doing it at your own risk. Under no circumstances is Trendsharks responsible for any capital losses or damages you might suffer, while using the company’s products and services. For more information read our Terms & Conditions and Risk Disclaimer.


