The price action of the GBPJPY pair generated a remarkable, bullish trend over the last couple of weeks, as the pound gained ground against most of the other major currencies. As has already been stated on multiple occasions, part of the reason for the nearly vertical rally is the global energy crisis, which has prompted heightened investors' demand for lower-risk securities.
While the risk from adverse fluctuations while implementing contrarian trading strategies remains quite substantial, there are mounting reasons to expect a possible correction in the near future. Earlier today, it was revealed that headline inflation in the UK has edged lower in September, which dented the previously ostensibly bullish bias. This trend could be bolstered further tomorrow when the Statistics Bureau is scheduled to post the Japanese CPI numbers for the same period.
Less risk-averse bears could possibly try to implement contrarian trading strategies on the expectations for such a correction in the near future, though they should remain mindful of the persisting uncertainty in the market. Bulls, in contrast, could wait and see whether such a dropdown does occur before they utilise trend continuation trading strategies.
What Goes Up, Must….
Notice that the latest rally began following the completion of a massive three-drive pattern, as shown on the daily chart below. Following the decisive breakout above the 61.8 per cent Fibonacci retracement level at 152.564, the price action started appreciating almost vertically. Even more importantly, the rally broke out above the historically significant resistance area that is currently underpinned by the 23.6 per cent Fibonacci at 156.081.
More often than not, such prominent breakouts/breakdowns tend to signify the climax of the underlying rally, which predicates the possibility for a subsequent correction. The currently developing Shooting Star pattern at the peak of the uptrend further implies this.
Unsurprisingly, the target for such a correction would be the resistance-turned-support at 156.081, which would soon be crossed by the 10-day MA (in blue). The mere fact that the price action is currently positioned so high above this low-magnitude moving average alone is enough to prompt a bearish correction.
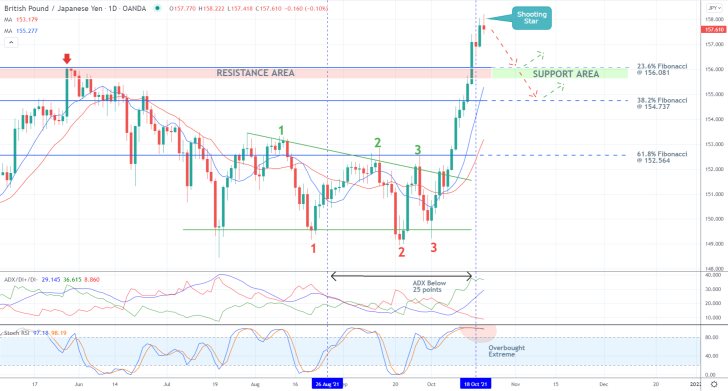
The steep ascend of the price action over the last several days is emphasised for a reason. Notice that the ADX indicator has been threading below the 25-point benchmark over the period spanning between the 26th of August and the 18th of October. This means that the market has technically been trending just over the last couple of days.
Hence, despite its remarkable size, the last upswing is more closely reminiscent of an adverse fluctuation within an established range rather than the beginning of a new directional price swing. This corroborates the expectations for an upcoming dropdown. Especially given that the Stochastic RSI indicator is currently threading in its overbought extreme.
Breaking Down the Current Selling Opportunities
The MACD indicator on the 4H chart below has already recorded a bearish crossover in the underlying momentum. Its histogram has started turning negative as well. Additionally, the aforementioned Shooting Star candle takes the form of an Evening Star structure, further elucidating the rising bearish pressure.
Traders should monitor the Ichimoku Cloud carefully as it represents the floating zones of intense bullish bias. In other words, any bearish correction is likely to be tested once it reaches the bullish cloud.
If the price action manages to penetrate below the Ichimoku indicator's conversion line (currently at 157.566) decisively, this would likely mark the beginning of the correction. However, before the price action could reach the 23.6 per cent Fibonacci, it would have to probe the Ichimoku indicator's baseline (currently at 156.664).
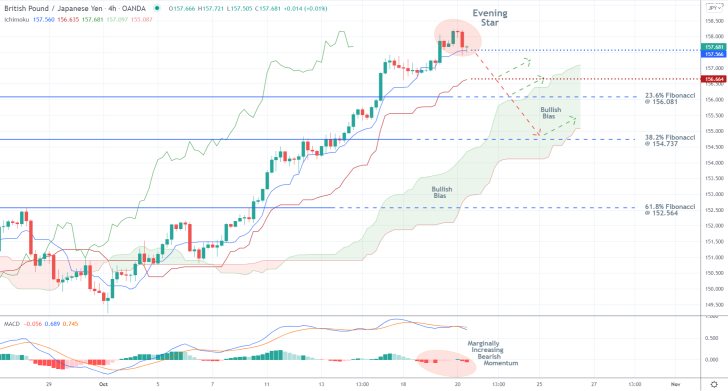
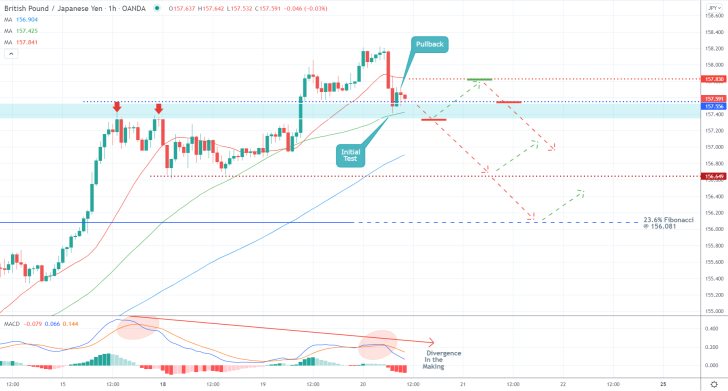
Finally, direct your attention towards the hourly chart below. This time, the MACD indicator is signalling the beginning of a new divergence in the making, which is inlined with the expectations for a subsequent dropdown.
Both bulls and bears should take notice of the fact that the 50-day MA (in green) is about to converge with the aforementioned support level at 157.556, making it an even more prominent threshold. A potential breakdown below it would represent an additional confirmation of the beginning of a new correction.
Concluding Remarks
Bears can place short limit orders just below the 50-day MA (below 157.556). They can also use the 20-day MA (in red) as a reference point for their risk management strategies. Chiefly, bears can place their stop-loss orders just above the minor resistance at 157.830.
As stated earlier, the 156.081 support level represents the most significant target for bears. However, given the importance of the minor support level at 156.649, bears can substitute their fixed stop orders for floating TPs once the price action reaches it. That way, they can protect themselves against sudden changes in the direction of the price action while still managing to catch the likely extension of the correction below 156.649 and towards the 23.6 per cent Fibonacci.
In contrast, bulls can look for signs of consolidation of the price action above either of the aforementioned supports before they can open any long positions. At any rate, they should not place their supporting stop-loss orders more than 40 pips below their initial entry levels.
Bulls can also implement floating TPs right from the start since they would be trading on the expectations for the continuation of the current upswing further up north and into uncharted territory.
Falling Wedge Developing at the Peak of GBPJPY's Uptrend
The price action of GBPJPY is currently developing a classic Falling Wedge, which is a type of pattern that is typically taken to signify likely trend continuation. A potential breakout above its upper limit would potentially indicate the likely extension of the underlying uptrend further up north.
Earlier today, it was revealed that Chinese factory activity reached a four-month peak in October, which underpins a global rebound in manufacturing. This would likely calm investors down, potentially leading to diminished demand for lower-risk securities. The likely outcome would be yet another yen depreciation.
As regards the current outlook of the British pound, most volatility would probably be registered on Thursday when the Monetary Policy Committee (MPC) of the BOE is expected to adopt a slightly more hawkish tone. Such a turn of events would likely have a positive impact on the value of the sterling in the short term.
If the price action of the GBPJPY continues to consolidate around the current support level over the next couple of days, bulls would have an opportunity to implement trend continuation trading strategies.
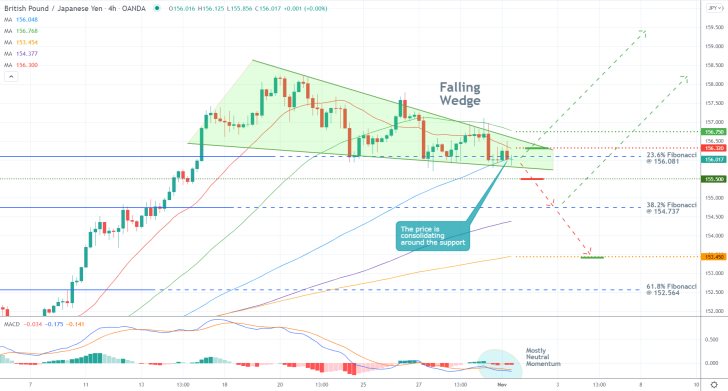
As can be seen on the 4H chart above, the lower limit of the Wedge is currently converging with the 100-day MA (in blue) and the 23.6 per cent Fibonacci retracement level at 156.081. On the other hand, the bottleneck of the Wedge is also underpinned by the concentration of the price action below the 20-day MA (in red) and the 50-day MA (in green).
The bottleneck itself signifies diminished volatility, which is also illustrated by the current reading of the MACD indicator. The next decisive breakout/breakdown away from the Wedge would thus demonstrate whether the underlying trend would indeed continue to climb higher or the price is due for another reversal.
Bears should only consider entering short on the condition that the price action breaks down below the 155.500 support level decisively. Their supporting stop-loss orders should not be placed more than 30 pips above their initial entries.
The first target level for such contrarian trading is the 38.2 per cent Fibonacci at 154.737, which is about to be crossed by the 150-day MA (in purple). Unless a rebound occurs there, the dropdown could then be extended even lower towards the major support level at 153.450. The latter is underscored by the 200-day MA (in orange).
In contrast, bulls can consider placing their trend continuation buying orders on the condition that the price action closes above the upper limit of the Wedge, currently underpinned by the 20-day MA at 156.320. More risk-averse bulls can enter long once the price action penetrates above the 156.750 major resistance level decisively. The 50-day MA underpins the latter.
Bulls' stop-loss orders should not exceed 30 pips as well. Meanwhile, their first target would be the previous swing high around 158.200. Once the price action nears this important threshold, bulls would be able to substitute their fixed stop orders for floating TPs in order to catch the maximum out of a potential breakout above the previous swing peak.
GBPJPY Set for a Pullback from the Recent Dip
The price action of the GBPJPY recently reached a new dip in an established downtrend, which is now likely to be followed by a subsequent pullback. This would offer bulls the chance to enter long by implementing contrarian trading strategies in anticipation of another upswing towards the next support-turned-resistance level.
Markets had an adverse reaction to BOE's newly-adopted hawkishness last week when two of the Monetary Policy Committee (MPC)'s nine members voted in favour of lifting the Official Bank Rate at the present moment. This exacerbated the pound's selloff in the short term.
However, the greenback's woes might be temporarily suspended on Thursday when the Office for National Statistics is scheduled to publish the quarterly GDP growth numbers. According to the preliminary forecasts, the British economy is expected to have expanded by 1.5 per cent in the three months leading to September. The GDP data could therefore catalyse the expected pullback on the GBPJPY.
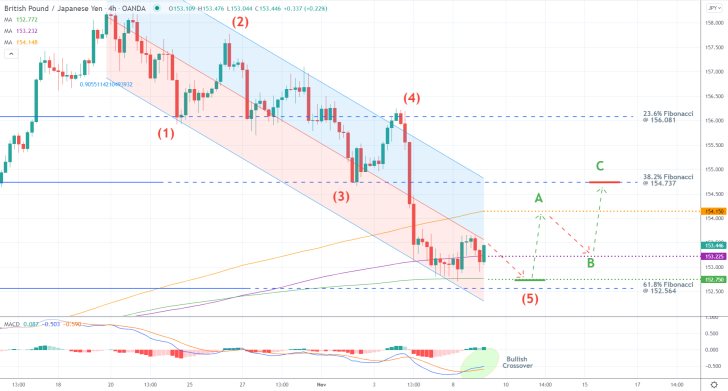
The latest downtrend on the GBPJPY is represented as a regression channel on the 4H chart above. A breakout of the price within the channel's middle portion would signify mounting bullish bias. It should be mentioned that for the time being, the price action appears to be consolidating near three converging supports. This also corroborates the expectations for a subsequent pullback.
A major 1-5 impulse wave pattern, as postulated by the Elliott Wave Theory, has bottomed out just above the 61.8 per cent Fibonacci retracement level at 152.564. Meanwhile, the 400-day MA (in green) and the 300-day MA (in purple) also make the support area above 152.564 a prominent turning point. All of this is complemented by a recent uptick in bullish momentum, as underpinned by the MACD indicator.
Bulls can place long limit orders at the 153.225 support level (underscored by the 300-day MA), with supporting stop-losses that are no more than 20 pips below the 61.8 per cent Fibonacci at 152.564. They can also place their take-profit orders at the 38.2 per cent Fibonacci at 154.737.
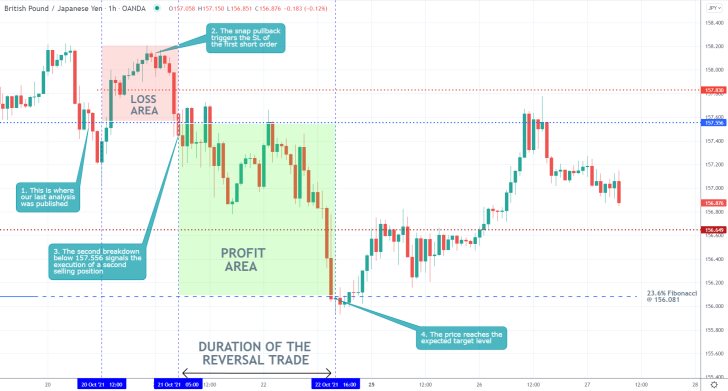
- Despite some initial tribulations, our last analysis of GBPJPY is so far turning profitable. The snap bullish pullback that ensued shortly after the publication of the analysis hit the stop-loss order that was placed at 157.830.
- However, the subsequent breakdown below 157.556 signalled the execution of another selling order, which turned profitable after the price action fell to the target level at 156.081 (the 23.6 per cent Fibonacci retracement level).
- This goes to show why it is so important for traders to have the mental stamina to endure adverse fluctuations. Just because a single trade does not pan out exactly as expected from the first time, it doesn't mean that it cannot be tried a second time.
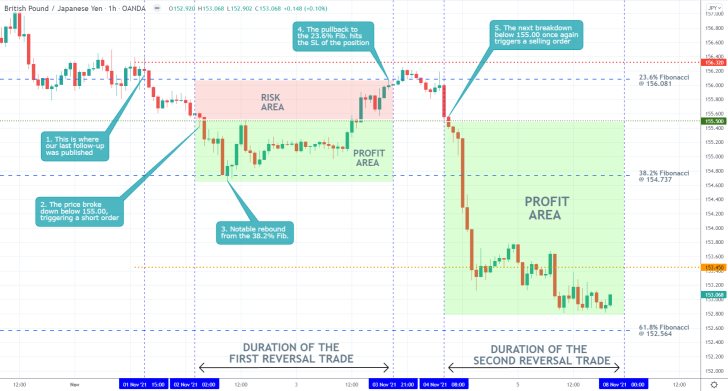
- Our last follow-up analysis of GBPJPY successfully forecasted a breakdown below the 155.00 support level and a subsequent dropdown towards the 61.8 per cent Fibonacci retracement level at 152.564.
- However, there were some intermittent fluctuations that hit the initial stop-loss order.
- This is a good reminder of why traders who trust their judgement sometimes might need to execute several orders before they get a desirable entry. That is why they should not give up on a particular setup if it does not work out from the first attempt.
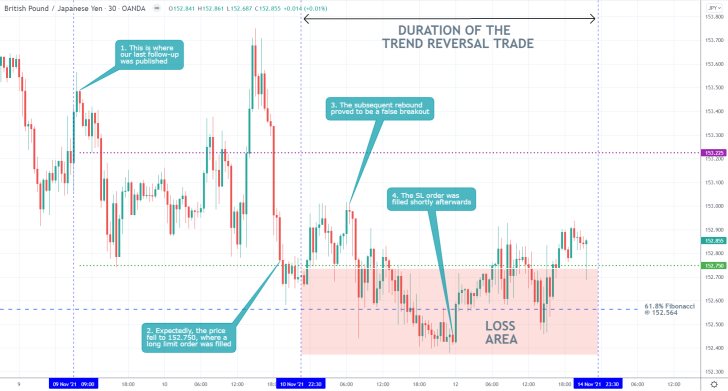
- The price action of the GBPJY pair expectedly fell to the 152.750 support level, as expected, shortly after the publication of our last follow-up analysis. This is where a long limit order was filled.
- However, a trend reversal did not occur there, and the subsequent dropdown below the 61.8 per cent Fibonacci retracement level at 152.564 triggered the stop-loss order just below it.
Disclaimer: Your capital is at risk! Trading and investing on the financial markets carries a significant risk of loss. Each material, shown on this website, is provided for educational purposes only. A perfect, 100% accurate method of analysis does not exist. If you make a decision to trade or invest, based on the information from this website, you will be doing it at your own risk. Under no circumstances is Trendsharks responsible for any capital losses or damages you might suffer, while using the company’s products and services. For more information read our Terms & Conditions and Risk Disclaimer.


