The EURUSD started developing a new major downtrend recently, as per our earlier projections. By the end of last week, however, the price corrected some of the losses by retracing up north. Seeing as to how the underlying price action still appears to be entailing ostensibly bearish bias, this could create some interesting trading opportunities.
This week looks poised to be quite uneventful due to the fact that there are only a few economic releases scheduled to occur over the next five days, which implies a likely subdued price action for all major pairs. This assertion stems from the expectations for low trading activity because of the lack of potentially significant market drivers this week, resulting in low liquidity levels.
This environment is unlikely to incite any significant changes to the underlying direction of major assets such as the EURUSD, which is why last week's bullish pullback is not expected to transition into a new uptrend. In other words, the development of the aforementioned downtrend is likely to be continued this week. Hence, traders could look for an opportunity to use trend-continuation strategies on the expectations for further probing of the pair down south.
These projections for another bearish reversal on the EURUSD are further supported by the expectations for rising consumer prices in the U.S., which would drive inflation higher. The latest inflationary report in the U.S. is scheduled for release on Wednesday. Overall, the underlying fundamentals seem to be aligning favourably for EURUSD bears.
1. Long-Term Outlook:
The daily chart below perfectly captures the make-it-or-break-it point that the EURUSD currently finds itself in. On the one hand, the latest downswing emerged from the multi-year resistance level at 1.23000, which is in itself demonstrative of robust bearish pressure. The reversal took the form of a Head and Shoulders pattern (as indicated by the blue circles), representing yet another confirmation of the rising bearish bias in the market. This is also underpinned by the fact that the price action is currently concentrated below the 20-day MA (in red) and the 50-day MA (in green), with the former crossing below the latter.
On the other hand, last week's bullish pullback occurred at a very crucial place - the 100-day MA (in blue) converging with the ascending trend line and the 23.6 per cent Fibonacci retracement level at 1.19429. The collection of so many floating and fixed supports at one place represents a major psychological barrier for the currently developing downtrend, and last week's bullish pullback could potentially signify the price action's inability to continue advancing further down south.
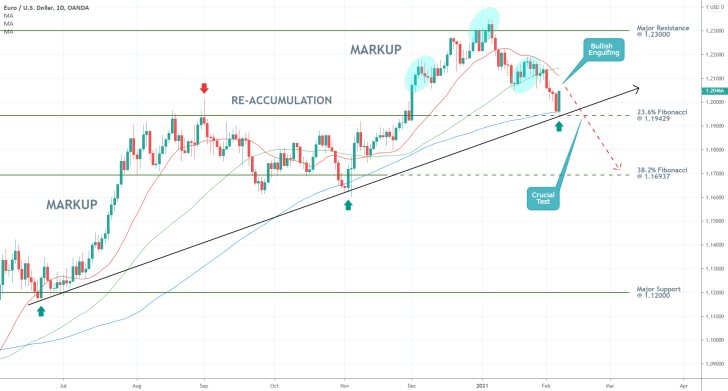
Notice that the 23.6 per cent Fibonacci retracement level served as an upper boundary of the previous Re-Accumulation range, which further underscores the latter's significance as a prominent turning point.
In other words, the price action would have to break down below the ascending trend line, the 100-day MA, and most importantly the 23.6 per cent Fibonacci before the continuation of the downtrend's development could be confirmed. If it manages to do so, the next target level for the price action would be the 38.2 per cent Fibonacci retracement level at 1.16937.
2. Short-Term Outlook:
As can be seen on the 4H chart below, the currently emerging downtrend is represented as a downwards sloping channel and a 1-5 impulse wave pattern, as postulated by the Elliott Wave Theory. The second impulse leg (2-3) was terminated just above the 23.6 per cent Fibonacci, which means that last week's bullish pullback also serves the role of the second retracement leg (3-4) of the impulse wave pattern.
Therefore, it can be asserted that after the pullback reaches a new peak, the price action is likely to resume heading lower in a bid to complete the final impulse leg (4-5). If this does indeed occur, the final impulse leg would have to sink lower than the second impulse leg (2-3), which implies a likely breakdown below the 23.6 per cent Fibonacci. That is why market bears could look for an opportunity to use such trend-continuation trading strategies at the resulting peak at point 4.
Such a peak is likely to occur near the descending channel's upper boundary, which is about to converge with the temporary resistance at 1.20600. The latter's significance stems from the fact that it was the dip of the first impulse leg (0-1) of the pattern. Moreover, the 50-day MA and 100-day MAs are also nearing this resistance (and the channel's upper boundary), which makes it very likely for the second retracement leg (3-4) to be exhausted around 1.20600.
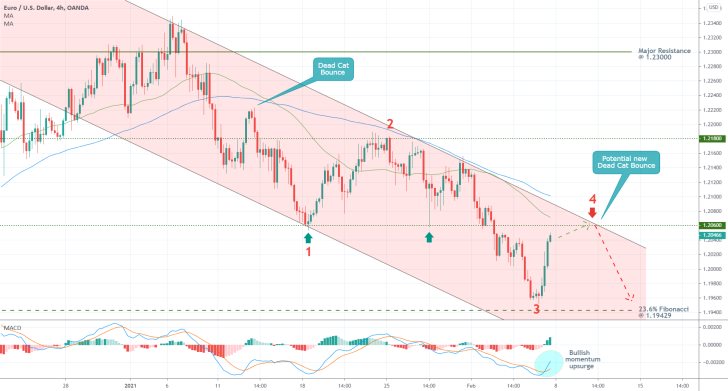
Despite the recent upsurge in bullish momentum, as underpinned by the MACD indicator, the underlying market sentiment remains mostly bearish. And if the price action does indeed reach a peak near point 4 (as depicted on the chart above), this would result in the creation of yet another Dead Cat Bounce pattern. This particular structure entails the probable preservation of bearish bias in an established downtrend, thereby confirming the expectations for further price depreciation.
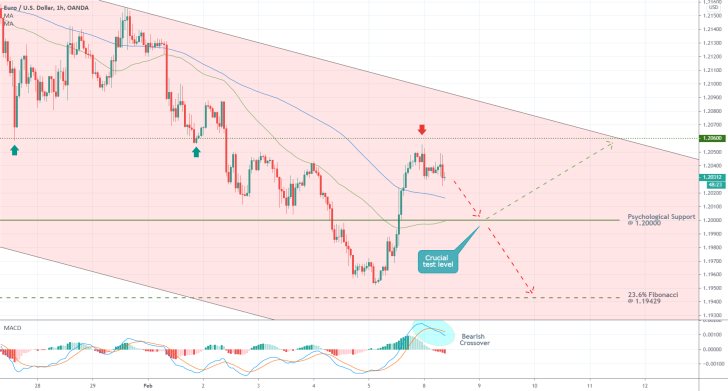
Such a peak at point 4 may already have been reached, as demonstrated on the hourly chart below. The recent bearish crossover on the MACD substantiates this assertion.
Despite the fact that the two moving averages are maintaining their bearish relationship - the 50-day MA trading below the 100-day MA - there might be more hurdles ahead for the bears. Namely, the two MAs are currently converging with the psychologically significant support at 1.20000. It would take a decisive breakdown below the latter to confirm that the bullish pullback is indeed over. Meanwhile, bears should keep in mind that more bullish rebounds could occur from this psychological support.
3. Concluding Remarks:
Bears could start looking for an opportunity to utilise trend-continuation strategies around the current market price; however, they should keep in mind that the continuation of the broader downtrend's development is not at all certain. More bullish pullbacks could emerge from the area between the psychological support at 1.20000 and the 23.6 per cent Fibonacci retracement level. Risk-averse bears could instead look for an opportunity to sell the EURUSD after a decisive breakdown below the 23.6 per cent Fibonacci occurs.
In contrast, there do not seem to be a lot of trading opportunities for bulls in the short term. They would instead have to wait and see whether the price action consolidates above the ascending trend line next (as seen on the daily chart), which would imply mounting bullish sentiment. If this does indeed take place, bulls could potentially use trend-reversal strategies once the price action is clearly ready to start advancing north.
The EURUSD Hasn't Bottomed Out Yet
The bearish pressure on the EURUSD is not yet completely exhausted. Even though the pair spent the entire last week recuperating from prior losses, there is still room for more downswings.
This week is filled with important economic releases for both the euro and the dollar, bound to stir heightened volatility. On Wednesday, the U.S. Census Bureau is scheduled to release the retail sales numbers for January, which are expected to register a positive rebound in sales. If these projections are realised, this would likely strengthen the greenback in the short-term.
Meanwhile, the German and French Services and Manufacturing PMI data for the same period is scheduled for publication on Friday. The consensus forecasts anticipate deteriorations in the industrial activity of the Eurozone's largest and second-largest economies, respectively. Consequently, the recently observed upsurge in demand for the single currency could wane marginally by the end of the week.
The underlying fundamental factors thus seem favourable for another bearish reversal of the EURUSD over the next five days.
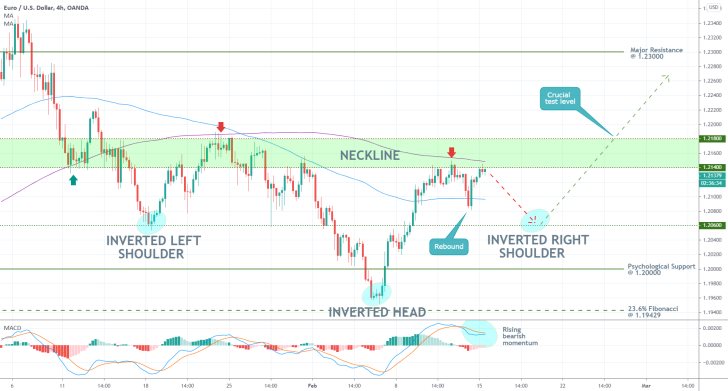
As can be seen on the 4H chart above, the EURUSD appears to be in the process of establishing an Inverted Head and Shoulders pattern. This is a type of pattern that is typically found at the bottom of a downtrend and is taken to represent a potential resurgence of bullish sentiment. In other words, the EURUSD is likely to recover over the next few weeks; however, the situation looks different in the short-term.
Given the above-mentioned fundamentals, another dropdown towards the 1.20600 support seems highly plausible, which is necessary for the development of the Inverted Right Shoulder. This is further substantiated by the fact that the price action appears to be consolidating below the 200-day MA (in purple), which is currently converging with the lower boundary of the Neckline area. Moreover, the MACD indicator underpins a recent resurgence of bearish momentum.
However, bears should take notice of the bullish rebound from the 100-day MA (in blue) that took place last week. This behaviour of the price action indicates that the underlying bearish bias at present is not yet decisive.
Overall, market bears could try to take advantage of the expected dropdown towards 1.20600; nevertheless, they should be especially careful with potential adverse fluctuations. That is why their stop-loss orders should be positioned close to the recent upswing (near the 200-day MA).
In contrast, bulls do not seem to have any possibilities for trading in the near future. Instead, they could wait for the Inverted Right Shoulder to be completed before they can implement trend continuation strategies. In other words, they could look for an opportunity to go long near the same 1.20600 support. The longer-term goal for such a bullish rebound would entail a potential breakout above the Neckline Area's upper boundary at 1.21800, and towards the major resistance at 1.23000.
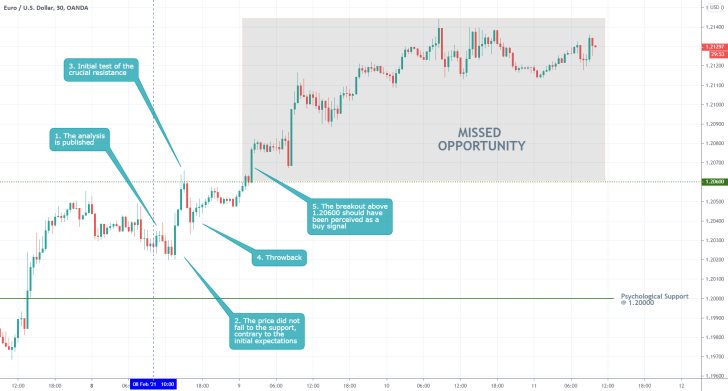
- The analysis' expectations for a more significant dropdown were not realised as the price action did not fall to the psychological support at 1.20000. Even though no losses were incurred, the biggest fault of the analysis was its underestimation of the potential bullish strength. In other words, the suggestion that there were no good bullish opportunities at present turned out to be completely unjustified.
- That is why traders should keep an open mind and change their opinions as new data becomes available. Otherwise, they risk deluding themselves by starting to look for evidence justifying their preconceived assumptions, which is not what real analysis is about.
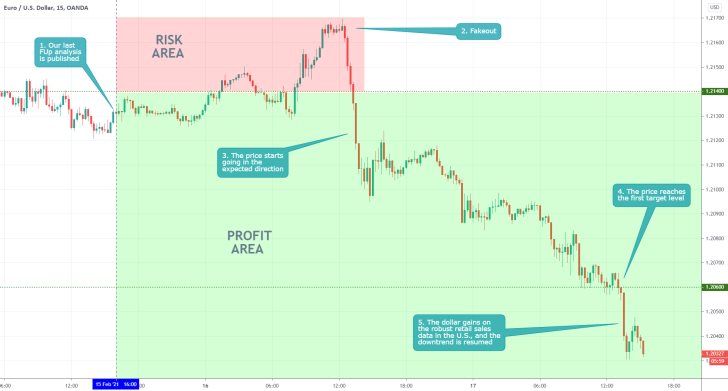
- The projections of the last follow-up analysis are so far being realised with the price action probing below the 1.20600. The breakdown was prompted by the much better-than-expected U.S. retail sales numbers for January.
- Bears should not rush to collect their profits unless the price action were to retrace back above 1.20600. If this were to happen, the expectations for a Head and Shoulders pattern could potentially be realised.
- Bears who already have running positions could use floating take-profit/stop-loss orders to squeeze the maximum out of the currently evolving downswing.
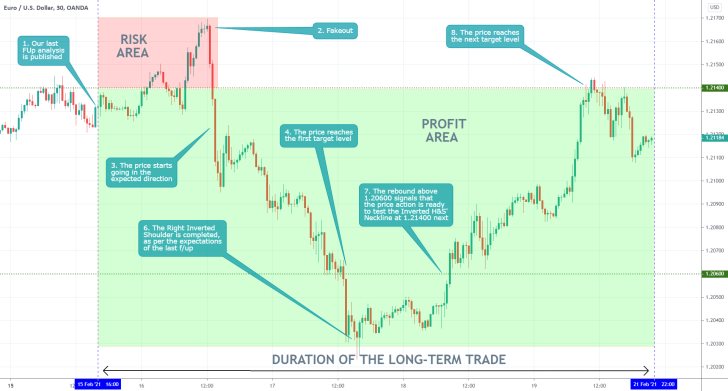
- One of the best performances to date! The last follow-up analysis successfully caught the initial downswing and the subsequent upswing. That is owing to the fact that it projected quite accurately the development of an Inverted Head and Shoulders pattern.
- The biggest takeout here is that whenever there is a strong confluence of technical and fundamental signals, there is strong justification to trade on the evolving setup.
Disclaimer: Your capital is at risk! Trading and investing on the financial markets carries a significant risk of loss. Each material, shown on this website, is provided for educational purposes only. A perfect, 100% accurate method of analysis does not exist. If you make a decision to trade or invest, based on the information from this website, you will be doing it at your own risk. Under no circumstances is Trendsharks responsible for any capital losses or damages you might suffer, while using the company’s products and services. For more information read our Terms & Conditions and Risk Disclaimer.


