The price action of the EURUSD has registered an upsurge in adverse volatility over the last several days, leading to massive seesaws. This was caused by diverging economic data in the Eurozone and the U.S. And given the currently unfolding COP26 conference, overall uncertainty is likely to grow even more.
The newly adopted hawkishness of the European Central Bank emboldened euro bulls who now see the plan of the ECB to gradually take its foot off the gas as good news for the single currency.
On the other hand, things are less clear cut with regards to the dollar. The robust earnings season of Big Tech is likely to strengthen the demand for the greenback of international investors. However, diverging manufacturing numbers underpin the still bumpy and uneven U.S. recovery.
While Chinese factory activity shot up in October, U.S. manufacturing eased marginally over the same period. Such discrepancies in production are likely to put the greenback at a disadvantage against currencies of developing economies.
Overall, the biggest catalyst for EURUSD's next price swing will be the FED monetary policy decision on Wednesday and the October non-farm payrolls, which are scheduled for release on Friday. FOMC's take on inflation coupled with the expectations for solid job gains could propel the greenback higher, though many uncertainties remain.
The current setup is not suitable for highly risk-averse traders, though more speculative ones can attempt to take advantage of the situation by utilising volatility-based trading strategies. Those could be either reactive or proactive. At any rate, they should keep in mind that the price action currently finds itself at the lower end of a major downtrend, and a potential rebound would entail even more adverse fluctuations in the near term.
Very Early Signs of a Potential Trend Reversal Over the Following Weeks
As can be seen on the daily chart below, the latest downswing, being part of the broader downtrend, was initiated following the completion of a Double Top pattern. The price action then went on to consolidate above the previous swing low at 1.15250. It established two consecutively higher bottoms, which represents a very preliminary indication of a potential trend reversal.
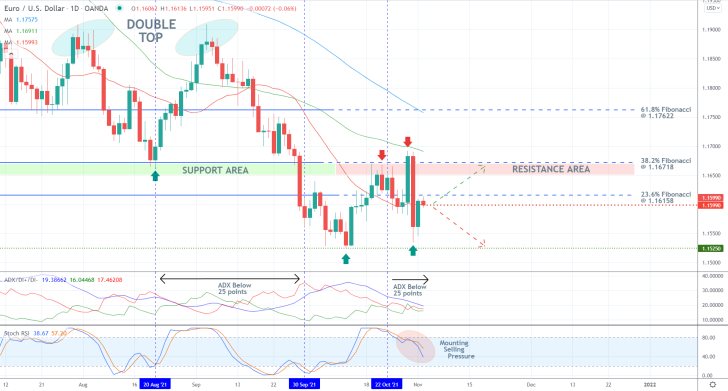
The ADX indicator is once again threading below its 25-point mark, which is inlined with the expectations for a bullish rebound from the latest dip. Nevertheless, the Stochastic RSI indicator is exhibiting mounting selling pressure, thereby challenging those forecasts.
Such opposing indications underpin the above-mentioned upsurge in adverse volatility, which can also be seen by the snap reversal from the 38.2 per cent Fibonacci retracement level at 1.16718. This Bearish Engulfing highlighted the significance of the major support-turned-resistance area just below the 38.2 per cent Fibonacci, which is currently converging with the 50-day MA (in green). It would take a decisive breakout above this major turning point to confirm the establishment of a new uptrend.
Presently, the price action is contained within the 20-day MA (in red), which underpins the major support level at 1.15990, and the 23.6 per cent Fibonacci at 1.16158. How the price action reacts next within this narrow bottleneck would demonstrate whether it would be able to test the 38.2 per cent Fibonacci yet again, or a subsequent downtrend would ensue to the previous swing low.
Expect More Fluctuations Around this Threshold
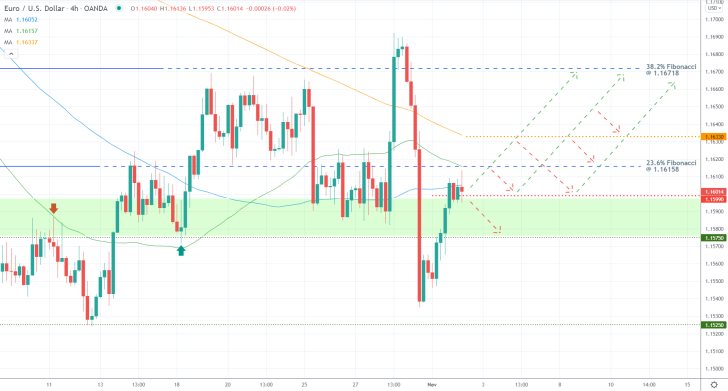
An even more intricate bottleneck can be observed on the 4H chart below. It spans between the aforementioned 1.15990 support and the 100-day MA (in blue). The last four candlesticks have all been contained within the boundaries of this narrow range.
By virtue of examining the twists and turns of the last upswing (to the 38.2 per cent Fibonacci), a minor support area (in green) can be drawn with its lower limit at 1.15750. Hence, a break below 1.15990 would likely be followed by a dropdown to the latter before the bullish momentum can be reinvigorated.
Conversely, a breakout above the 100-day MA followed by a possible penetration above the 23.6 per cent Fibonacci, which is currently converging with the 50-day MA, could then lead to an upswing towards the 1.16330 resistance level. It is currently underpinned by the 200-day MA (in orange).
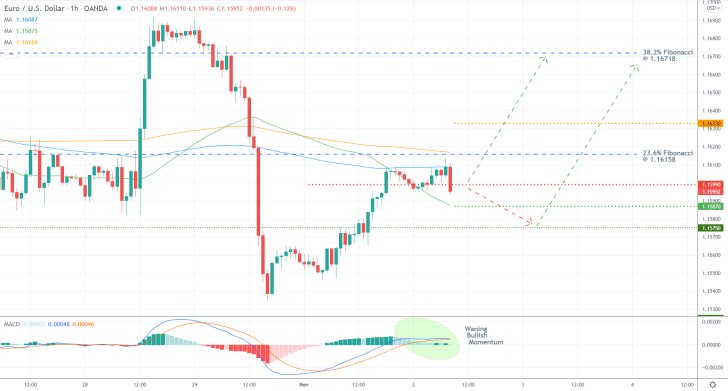
The 200-day MA is converging with the 23.6 per cent Fibonacci on the hourly chart below, making it an even more prominent turning point. The close proximity of the 100-day MA adds to that. Meanwhile, the 50-day MA currently underscores an important support level at 1.15870.
The moving averages and the aforementioned thresholds illustrate the temporary consolidation range where the price action is likely to fluctuate within in the very short term before it gets ready to break out above the 23.6 per cent Fibonacci.
Traders should be mindful of this area of uncertainty, particularly since the underlying market sentiment is mostly neutral at present. This can be seen by the declining histogram of the MACD, while the two EMAs comprising the indicator are threading around the 0.00 level.
Concluding Remarks
The underlying setup seems slightly more favourable to bulls, though they should be cautious about entering long only at the dip of the next correction. They can either place a long limit order at 1.15750 or consider executing a market order once the price action breaks out above the 23.6 per cent Fibonacci. In either case, their supporting stop-loss orders should not be placed more than 30 pips away from their initial entries.
The first bullish target is the 38.2 per cent Fibonacci at 1.16718, though bulls should prepare for potential snap reversals from 1.16330.
EURUSD Developing an Inverted Head and Shoulders
The price action of the EURUSD pair is concentrated near the dip of the newest downtrend, potentially developing an Inverted Head and Shoulders. This type of trend reversal pattern underpins the possibility of a new uptrend, thereby creating interesting trading opportunities in the short term.
Despite the recent upsurge of bullish pressure on the U.S. dollar, the EURUSD rebounded last week following the November policy decision of the Federal Reserve. The greenback was not even bolstered by the overwhelmingly robust October non-farm payrolls. Both factors corroborate the expectations of a likely euro strengthening over the next several days.
However, the latest U.S. inflation numbers and German economic sentiment data, both of which are scheduled for publication this week, could cause even more volatility outbursts near the bottom of the current downtrend. Hence, bulls and bears should tread carefully when they execute orders near major support and resistance levels.
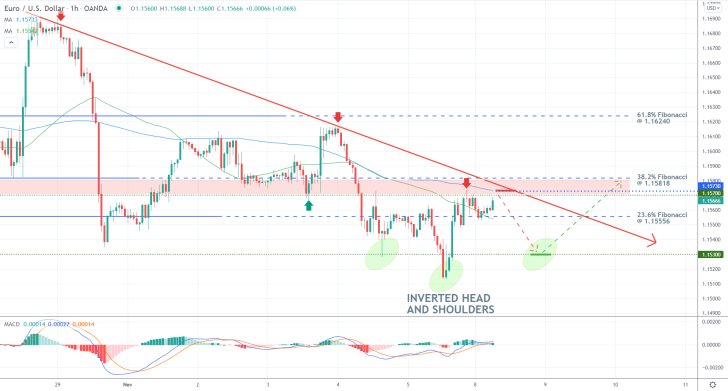
As shown on the hourly chart above, the price action appears to be establishing an inverted head and shoulders pattern between the previous swing low at 1.15300 and the 23.6 per cent Fibonacci retracement level at 1.15556. This is happening as the underlying bullish momentum is slowly increasing, as demonstrated by the MACD indicator.
The price action is currently consolidating within a significant bottleneck, spanning between the 23.6 per cent Fibonacci, which is currently converging with the 50-day MA (in green), and the major support-turned-resistance level at 1.15700. The latter is about to converge with the 100-day MA (in blue), making it an even more powerful turning point. Additionally, the nearby descending trend line (in red) serves as yet another important threshold.
Bears wanting to trade the H&S pattern can place short limit orders at 1.15700, with supporting stop-loss orders that do not exceed 10 pips above the 38.2 per cent Fibonacci at 1.15818. They can also place their take-profit orders at the previous swing low at 1.15300.
Accordingly, bulls can place long limit orders at that previous swing low with the intention of riding the subsequent uptrend. Once the price action penetrates above the 38.2 per cent Fibonacci, they can substitute their fixed stop orders for floating TPs. As regards their protection, bulls should not place their stop-loss orders more than 30 pips below their initial entries.
Trading EURUSD's Impulse and Retracement Legs
The EURUSD has been developing a massive downtrend since late-May 2021, and there are no signs of it slowing down. This creates interesting trading opportunities, primarily associated with picking the dips and peaks of the corrections within the trend.
The downtrend was bolstered recently following the latest economic developments. The decisions of the Federal Reserve and the ECB to dial back the pace of their asset purchases programs spells the end of the "happy times" on the stock market, which has so far been favouring the greenback.
The improving economic sentiment in Germany, the biggest economy in the Eurozone was not enough to offset the rally of the greenback, not even during the upsurge in adverse volatility following the latest U.S. inflation numbers. All of this signifies the likely continuation of the EURUSD's downtrend, which both bulls and bears can take advantage of.
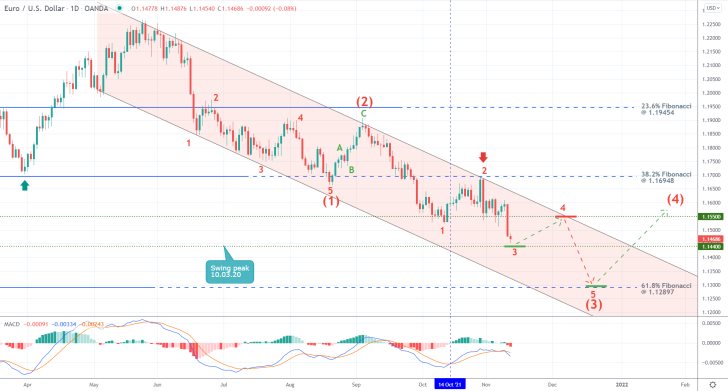
This downtrend is represented as a descending channel (in red) on the daily chart above. Moreover, it appears to be taking the form of a 1-5 impulse wave pattern, as postulated y the Elliott Wave Theory.
Currently, the price action appears to be developing the second impulse leg (2-3), which, in the long term, is likely headed towards the 61.8 per cent Fibonacci retracement level at 1.12897. Due to the fractal nature of the price action, the second impulse leg (2-3) is also likely to take the form of a 1-5 impulse wave pattern.
The minor (2-3) impulse leg has already reached the swing peak at 1.14400, which was last reached on the 10th of March 2020. This is where bulls can place long limit orders with supporting stop-losses no more than 30 pips away from their initial entries.
They can place their take profits at the major support-turned-resistance at 1.15500, which is likely to converge with the upper limit of the channel by the time the pullback draws near to it. Essentially, bulls would be trading on the expectations for the emergence of the second minor retracement leg (3-4).
It is worth pointing out that the two EMAs comprising the MACD indicator have been appreciating since the 14th of October, while the price action has been depreciating during the same time. This is demonstrative of a divergence in the making, corroborating the underlying forecasts. However, the broader market momentum remains ostensibly bearish-oriented.
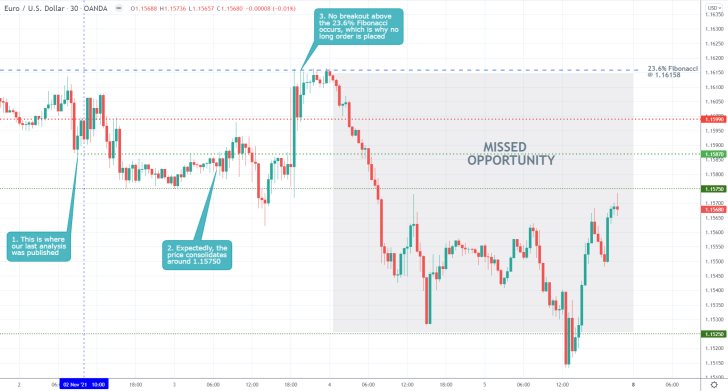
- Shortly after the release of our last analysis of EURUSD, the price expectedly consolidated around the 1.157550 support level. However, the subsequent rebound was not able to break out above the 23.6 per cent Fibonacci retracement level at 1.16158.
- The rebound was prompted by heightened volatility following the November policy meeting of the Federal Reserve.
- The inability of the price to break out above this psychologically significant resistance with the help of the FED should have been perceived as an opportunity to sell.
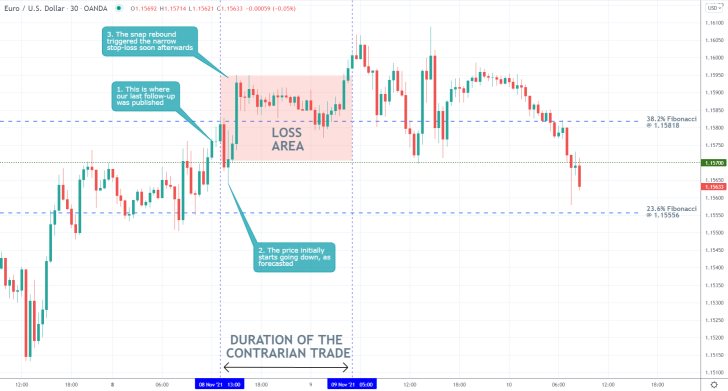
- The price action of the EURUSD did not reverse from the 38.2 per cent Fibonacci retracement level at 1.15816, as was forecasted by our last analysis of the pair.
- Instead, the adverse fluctuations hit the narrow stop-loss order shortly after the release of the follow-up.
- Despite the incurred loss, it should be mentioned that the applied risk management was appropriate, as it prevented even bigger losses.
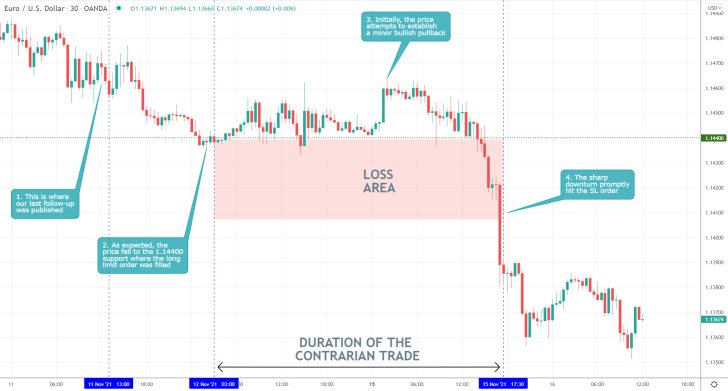
- The expectations of our last EURUSD follow-up analysis were not realised. The price action expectedly fell to the major support level at 1.14400, but a bullish pullback did not follow.
- Nevertheless, a long limit order was filled there on the expectations for such a temporary bullish correction. The sudden dropdown below this crucial threshold thus promptly triggered the supporting stop-loss order.
- Even though most trends are comprised of intermittent corrections that run in the opposite direction, that does not preclude the possibility for uninterrupted price depreciation/appreciation.
Disclaimer: Your capital is at risk! Trading and investing on the financial markets carries a significant risk of loss. Each material, shown on this website, is provided for educational purposes only. A perfect, 100% accurate method of analysis does not exist. If you make a decision to trade or invest, based on the information from this website, you will be doing it at your own risk. Under no circumstances is Trendsharks responsible for any capital losses or damages you might suffer, while using the company’s products and services. For more information read our Terms & Conditions and Risk Disclaimer.


