Twitter’s shares are once again soaring after the recent release of the earnings data for the fourth quarter of 2019 following a disastrous performance that was recorded in Q3 of the same year. The social media platform has managed to stabilise itself after reporting better-than-expected revenue data by surpassing the $1Billion mark. In doing so, the share price of twitter soared with more than 14 per cent last week, thereby partially offsetting the tumble that occurred after the release of the Q3 data in October last year, when the share price plunged with more than 22 per cent. The recent developments gave investors more reasons to be optimistic, and it also allowed traders to enter the market at what looks like the conclusion of the recent dip prior to the formation of a long-anticipated new bullish upswing.
The current analysis is going to examine the most recent data that was published in Twitter’s statements for Q4 and highlight the most likely future developments that are likely to occur on the company’s share price.
1. Long-Term Outlook:
As per the weekly price chart from below, it can be determined that currently, the price finds itself at the lower end of a major correction that occurred last October after the release of the aforementioned disappointing report. That is why some market experts expect to see reinvigorated directional price action to start taking place in the foreseeable future once the company's share price breaks out from its current consolidation stage and resumes trading in a trend. It is because of that reason that the bulls are looking for confirmation that the correction has exhausted itself so that they can go long at the resulting dip in anticipation of the continuation of the previous bullish trend.
Judging by the Average Directional Index (ADX), the strength of the trend is frail at the present moment because the indicator is currently below 25 index points. This assessment confirms the aforementioned correction, but it also builds the case for the eventual development of the anticipated break out in either direction.
The price has recently managed to break out above the middle level at 35.77 following the release of the robust earnings data; however, it has immediately fallen back to the support afterwards and is currently consolidating just above it. This means that at least for now, the price is not ready to continue appreciating. Moreover, the immediate development of a correction back to the support after the initial breakout has led some bears to weigh in on the possibility for the establishment of a false breakout, which would cause the price to continue tumbling towards C.
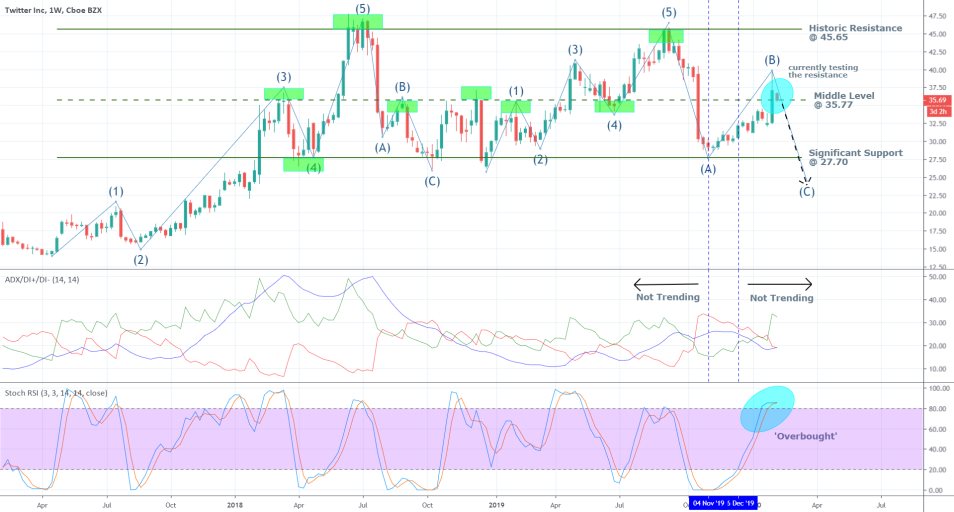
There is additional evidence supporting the potential continuation of the bearish downswing. First of all, under the Elliott Wave theory, which postulates that an ABC correction goes against the direction of the prevailing trend, a final BC impulse wave can be projected to occur with the price potentially falling below the significant support at 27.70 (below A). As can be seen above, the price action does not appear to have finished establishing the ABC correction, which means that there is still spare capacity for the price to continue going south. Second of all, since the price does not technically find itself in a trending environment, a range-specific indicator such as the Stochastic RSI (Relative Strength Index) can be utilised to evaluate the likely turning points for the buying pressure in the market. The indicator has recently entered into the ‘Overbought’ extreme and could potentially prompt the bulls to start closing out their long positions, which, in turn, would cause the price to go down due to the subsequent bearish prevalence in the market.
2. Earnings Frenzy:
The information that is presented in the earnings reports of publically traded companies is especially important for those companies' future performance on the stock market because they present invaluable insights into their operational performances. For Twitter's shareholders, the operational performance that was recorded in Q3 of 2019 was vastly disappointing due to the revelations that the company had suffered from diminished income from advertising. At the time, the New York Times observed that:
“The company had forecast that third quarter revenue growth would lag the first two quarters, partly because of the ending of some older ad formats. But it also encountered unexpected problems, such as bugs which impacted its ability to target ads and share data with ad partners, and fewer big events compared with the previous summer.”
It seems that since then the company has been able to undergo vital structural changes, as the problem was no longer so prevalent in the next quarter. When Twitter released its most recent data last Thursday, it was shown that its revenue had eclipsed the consensus forecasts for $996.7 million by reaching $1.01 billion. Thus, its market capitalisation has reached $29.8 billion. Additionally, the Magnetisable Daily Active Users (mDAUs) – a crucial metric of Twitter’s well-being – surged to 152 million from 147.5 million expected (21 per cent growth in Q4), which is an all-time record. Due to these outstanding results, Twitter’s share price rallied with more than 14 per cent last week, despite having registered a noticeable drop in net income.
In the statement, it was pointed out that the company's net income has reached $118 million in the three months ending December 2019, which is considerably less than the $255 million that had been recorded for the same period a year prior. Therefore, the Non-GAAP diluted net Earnings Per Share were revised down from $0.31 to $0.25. This sign of weakness is the primary reason why the share price corrected itself immediately after the rally that followed the release of the statement was concluded. It is yet to be seen whether this misfire in net income is going to turn out to be a minor and short-lived impediment or whether it is going to have longer-lasting consequences for the share price.
Meanwhile, Jack Dorsey, Twitter's CEO, had this to say about the company’s quarterly performance:
“2019 was a great year for Twitter. Our work to increase relevance and ease of use delivered 21% mDAU growth in Q4, with more than half of the 26 million mDAU added in 2019 directly driven by product improvements. […] Entering 2020, we are building on our momentum -- learning faster, prioritising better, shipping more and hiring remarkable talent. All of which put us in a stronger position as we address the challenges and opportunities ahead.”
Twitter finds itself in a very good spot right now with very favourable prospects for future growth. The company is going to build on the recent momentum, chiefly the growth in mDAUs, and continue to add intrinsic value to its operations. Sooner or later this extra added value is going to be positively reflected on its share price and cause it to surge. Nevertheless, the most pressing question right now is whether this anticipated hike is going to occur soon, or whether there is going to be an intermediate patch of subdued growth and muted price action.
The social media giant is likely to benefit from the outstanding performance of the Tech industry that is being observed this quarter. The solid quarterly data that was delivered by Apple, Tesla, Microsoft and others is likely to continue pushing the industry north, which, subsequently, is going to have a positive impact on Twitter’s shares.
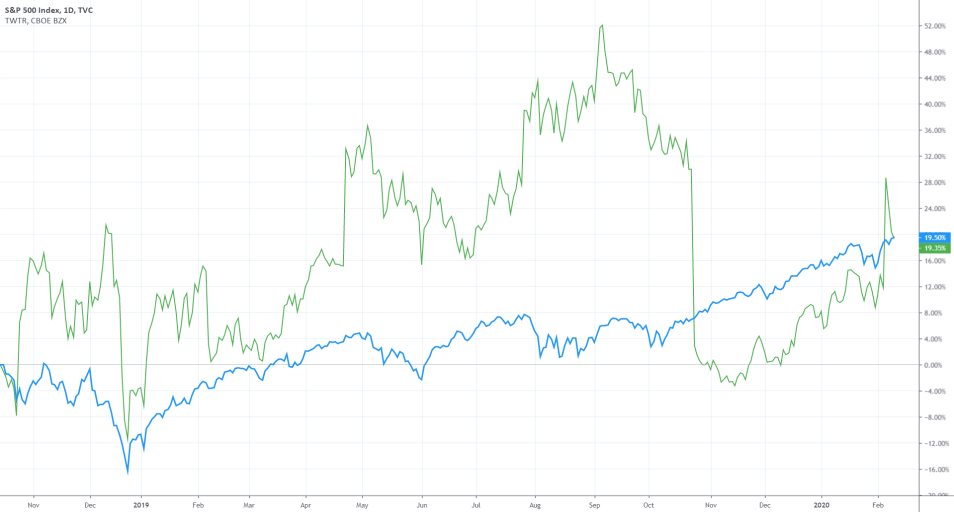
As can be seen from the comparison chart above, Twitter’s share price took a severe hit last October when it plunged way below the S&P 500 (SPX). Ever since then, however, it has been growing at a steeper angle compared to the index, which indicates the build-up of positive bullish sentiment. Following last week’s release, Twitter’ share price managed to surpass the index for the first time since October, which is an additional confirmation of its current recovery and a signal to the market bulls that the share price is likely to pick up the pace from here on and continue rising.
3. Short-Term Outlook:
As can be seen from the daily chart below, the price found strong resistance at the 38.2 per cent Fibonacci retracement level and bounced back below it afterwards. This is a strong indication that at least in the short-term, the bearish sentiment might be stronger than it looks at first glance.
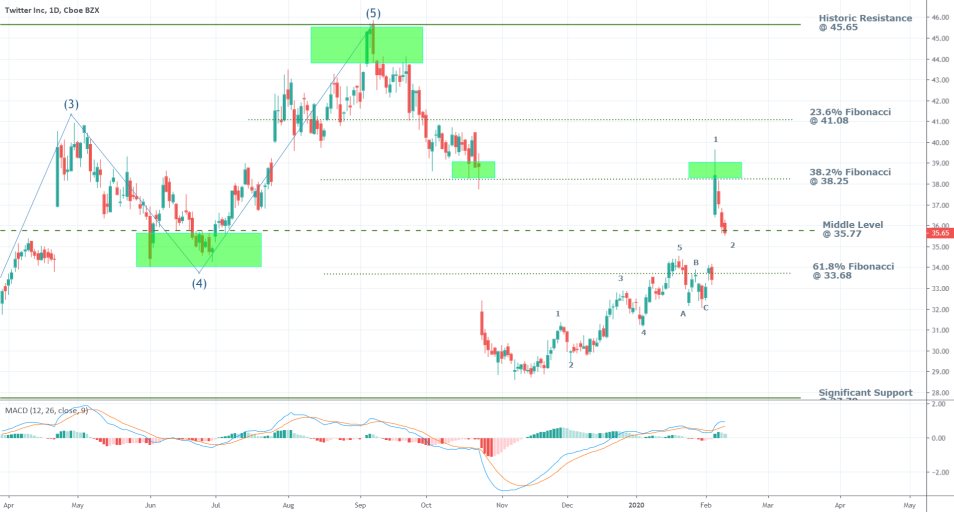
Nevertheless, the MACD remains positive, implying the persistence of the bullish momentum in spite of the recent correction. The price is currently consolidating just around the middle level at 35.77, and it is in the process of concluding the first retracement of the new 1-5 Elliott Wave Pattern. If the price fails to break down below 35.77 and instead finds support here, this would mean that the 1-2 wave would be finished here, which, in turn, would open up the opportunity for bulls to go long around the current level. If, however, the price falls below 35.77, the next likely support is the 61.8 per cent Fibonacci retracement level at 33.68. This means that the anticipated dip at the end of the 1-2 retracement could be found there, again opening up the opportunity for the execution of long trades there.
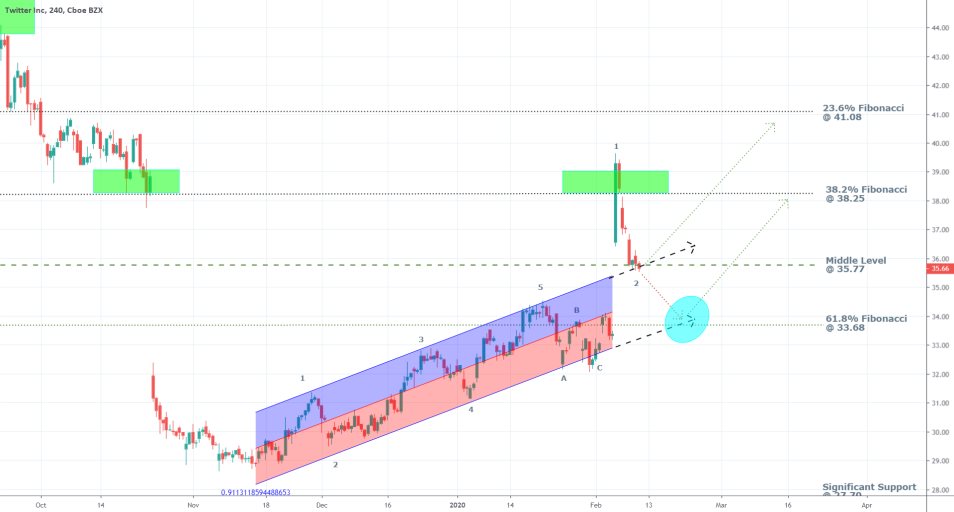
The 4h chart from above further confirms the importance of the middle level at 35.77 and the 61.8 per cent Fibonacci retracement at 33.68, as being likely turning points for the price action – attesting to the strength of the two respective support levels. The boundaries of the regression trend coincide with the two support levels, which increases their prominence.
4. In Conclusion:
The long term outlook looks partially bearish, given the anticipation for the conclusion of the corrective ABC pattern on the weekly chart, in addition to the ‘Overbought’ status of the Stochastic RSI. The latter may or may not prompt the execution of more short orders at the current price level, depending on how traders perceive the situation. Nothing can be fully confirmed at the present moment.
The fundamental outlook of Twitter, however, looks mostly positive, with more expectations for future growth, especially in mDAUs. This would likely bolster the share price of the company in the long-term.
In the short term, the share price appears to be at the lower end of the correction, which means that it is likely to reach a dip soon (if it already hasn't). Thus, the bulls would be looking for indications around the middle level of 35.77 and the support level at 33.68 that the downswing movement has exhausted its strength, and that the price is likely to surge afterwards. That is why the current market setup looks favourable for the execution of trend continuation trades.
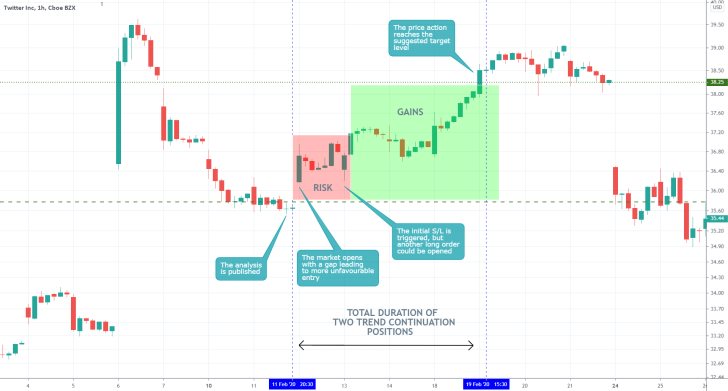
- Good idea for trend-continuation trading, but with poor execution. The behaviour of the price action was interpreted almost perfectly but the benefit of this was lessened by the relatively late entry into the market. Chiefly, a long order could have been opened the previous day, when the price action was clearly consolidating around the major support level at 35.77. Instead, the market opened with a gap on the 12th of February, which resulted in unfavourable entry. Hence, the SL was triggered on the first pullback. The first major takeaway from this setup is that it is undesirable to place orders after the market had opened with a huge gap, rather wait for a retracement. Even if this gap is inlined with your expectations, the fear of missing out on the opportunity could lead you to poor positioning, and consequently incurred losses.
- The second big takeaway from this scenario relates to the need of consistency. Most traders would despair after their first trade had failed them, compelling them to refrain from joining the market again. However, if you believe in the strength of your analysis, there is no need for you not to place another similar trade after the SL of the first had been triggered. For one, you'd have better positioning this time, and make up for the incurred losses.
Disclaimer: Your capital is at risk! Trading and investing on the financial markets carries a significant risk of loss. Each material, shown on this website, is provided for educational purposes only. A perfect, 100% accurate method of analysis does not exist. If you make a decision to trade or invest, based on the information from this website, you will be doing it at your own risk. Under no circumstances is Trendsharks responsible for any capital losses or damages you might suffer, while using the company’s products and services. For more information read our Terms & Conditions and Risk Disclaimer.


