The price of the December gold futures has been consolidating below the psychologically significant level at 2000.0 dollars per troy ounce since late-September. The price has attempted to bounce back north on several occasions but has been unable to break out above this significant threshold. This consolidation of gold's price has left some traders asking whether the bearish market is here to stay, or the bearish correction is going to be terminated soon.
In searching for an answer to this question, two major factors demand closer attention. First of all, many epidemiologists expect the number of coronavirus cases to shoot up in October and November. As the weather deteriorates in the Northern hemisphere, more people are expected to stay indoors, which, in turn, increases the likelihood of faster spread.
The first epidemic wave set a precedent for safe-havens, as the demand for gold skyrocketed during Q1 and Q2. It is fair to expect similar consequences from a second epidemic wave if panic and uncertainty are allowed to grapple the global financial markets yet again.
The market has already started to price in the likelihood of a second infectious wave in Europe, Asia and the US, which is affecting the price of the precious metal as well. The gradual nature of this discounting process is the primary reason as to why more sizable upswings on the price of gold have not been registered over the last several weeks. Nevertheless, in case that the momentum of the virus' spread accelerates once again, the price of gold is likely to register this in a more definite fashion.
Second of all, the upcoming presidential elections are bound to stir even more volatility as the voting date looms nearer. Even though Joe Biden garners a healthy lead over Donald Trump in the preliminary polls, the current President's erratic mood swings and unpredictable changes of policy direction are likely to unnerve investors in the following weeks.
Arguably, the biggest takeaway from the recent presidential debate is that Trump is most likely going to continue discrediting the validity of the electoral process. Chiefly, he is going to maintain his tempestuous rhetoric in order to deliver a blow to Biden's positive momentum in the polls.
11,00 North Carolina residents get incorrect voter registration forms. 2000 LA County Voters received “faulty” Ballots, with NO WAY TO VOTE FOR PRESIDENT. Many others throughout USA. Here we go. This will be the most corrupt Election in American History!
— Donald J. Trump (@realDonaldTrump) October 7, 2020
By continuously questioning the transparency and legitimacy of the upcoming elections, Trump is running the risk of stymieing the trust of US voters in the country's democratic principles. In turn, such actions are likely to resonate on the financial markets by causing a resurgence of uncertainty and fear. Consequently, the demand for safe-havens could lift-off once again, prompting a new uptrend for gold's price.
1. Long-Term Outlook:
As can be seen on the daily chart below, the immediate pressures are mostly driving the price action lower. Even though the bears seem to retain control at present, the longer-term outlook remains primarily bullish.
The price action has been establishing a flag pattern over the last several weeks, which could be interpreted as a potential interim pause in the development of the broader uptrend. Hence, a breakout above the upper border of the descending channel, coupled with a breakout above the 23.6 per cent Fibonacci retracement level at 1942.8, is going to be interpreted as definite signs signalling the continuation of set uptrend's establishment.
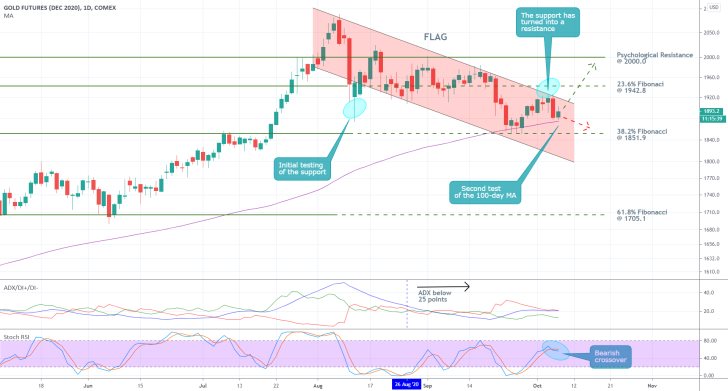
The prominence of this resistance area is further affirmed by the fact that it used to serve as a major support beforehand (as indicated by the two blue spheres). Additionally, the fact that the price action remains concentrated below set area illustrates the prevalence of bearish pressures at present.
It is not entirely implausible for the price action to tumble to the lower border of the channel, which would entail a temporary breakdown below the 38.2 per cent Fibonacci at 1851.9 before a rebound occurs, and the price finally manages to break out above the Flag pattern.
At present, the price action is threading just above the 100-day MA (in purple), which could serve as the expected turning point. However, this does not preclude the possibility of temporary fluctuations below the moving average in the foreseeable future. In other words, bulls should look for signs of reversal around the 100-day MA, but should also refrain from joining the market just yet.
2. Short-Term Outlook:
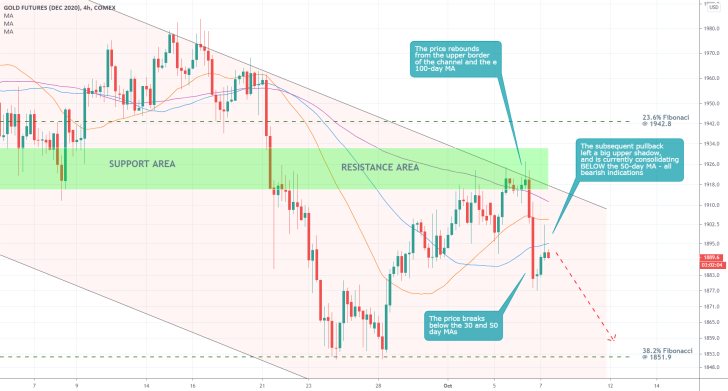
As can be seen on the 4H chart below, the price action made a U-turn yesterday, rebounding from the upper boundary of the descending channel and crossing below the three MAs – the 100-day MA (in purple), the 50-day MA (in blue), and the 30-day MA (in orange). This represents a significant piece of evidence demonstrating the mounting bearish pressure in the short-term.
The price is currently in the process of completing the latest bullish pullback, after which the downswing is expected to continue heading down south. Such pullbacks are commonplace after bigger breakdowns, such as the one from yesterday. All of this underpins the trend-continuation trading opportunities that are currently unfolding.
The bears can now join the market by entering into the broader downswing, which has been evolving over the last several weeks, while market bulls would have to wait for signs of reversal. The next significant support level is encapsulated by the 38.2 per cent Fibonacci at 1851.9.
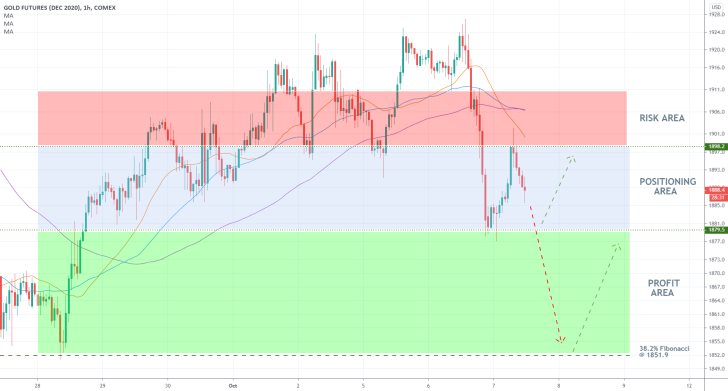
The hourly chart below demonstrates the short-term trading opportunities for the implementation of trend-continuation trading strategies for bears. Selling orders can be placed anywhere within the 'Positioning Area', on the expectations for a dropdown towards the aforementioned support.
Meanwhile, a reversal back within the 'Risk Area' would entail disruption of the bearish momentum, and the bears would better close their selling orders in order to wait for a potential entry with better prospects.
The market bulls, in contrast, do not seem to have any immediate trading opportunities, which means that they'd have to sit and wait for definite signs of reversal, potentially around one of the support levels, as seen on the hourly chart above.
3. Concluding Remarks:
The gold December futures contracts look poised to appreciate in the longer-term, particularly because of the expected upsurge in overall uncertainty in the markets - stemming from the US elections, and the future development of the coronavirus crisis. However, the shorter-term outlook is mostly bearish, which entails further dropdowns of the price in the next following days.
Waiting for the End of the Correction
Since the analysis of the December Gold futures was published last week, the price found strong support around the psychologically significant level at 1900.0 and started appreciating afterwards. The upswing came close to the 23.6 per cent Fibonacci retracement level at 1942.8, but then the price started tumbling. The price action appears to be ready to develop a minor bearish correction in an otherwise bullish market, as per the longer-term expectations of the analysis.
As regards the underlying fundamental factors that are currently affecting the price of the precious commodity, two key developments demand closer attention. Firstly, the impasse in the Brexit negotiations is threatening European markets, raising concerns over the future of the trade relationship between London and Brussels. Boris Johnson is attempting to pressure Emmanuel Macron and Angela Merkel into lowering the demands of the EU by threatening to break off the talks this week. It is yet to be seen whether his hard-line rhetoric is going to pay off.
At any rate, the overall uncertainty stemming from the unpredictability of the negotiations poses a significant threat for the economic future of the region, likely worrying investors. This, in turn, is likely to bolster the demand for safe-havens in the immediate future. Thursday is going to be of crucial importance, as that is the expected deadline by which Boris Johnson should decide whether or not to continue the talks with his European counterparts.
Secondly, the ongoing presidential debates in the US continue to create extra volatility in the global capital markets. Originally, Donald Trump and Joe Biden were supposed to face each other off this Friday for a second time. However, the President's camp has said that Trump would not be able to attend due to his recent contraction of the coronavirus.
The levels of adverse volatility affecting gold's price action are likely to continue rising as the election date comes closer. Hence, traders need to be cautious of erratic fluctuations and volatility outbursts – they should be extremely careful of placing tight orders around significant levels of support and resistance, as these are likely to turn into areas of considerable volatility.
As regards the recent technical outlook, the price action looks ready to establish a new bearish correction. The 4H price chart below illustrates this:
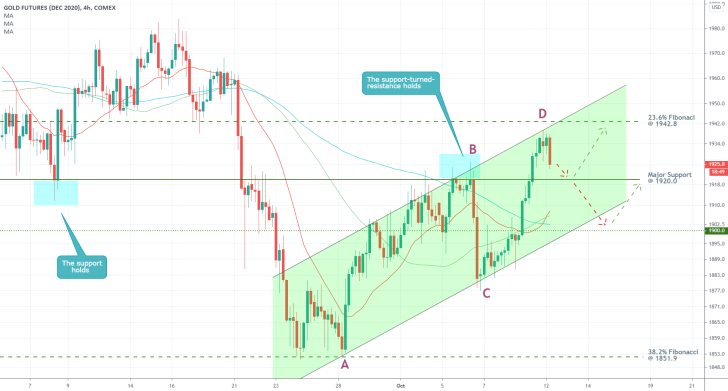
The upswing, which emerged from the 38.2 per cent Fibonacci retracement level at 1851.9, appears to be temporarily suspended just below the next Fibonacci barrier – the 23.6 per cent resistance at 1942.8. The last bearish Marabozu candle underpins the recent upsurge of underlying selling pressure.
The upswing itself has a classic shape and form – an ABCD pattern – which substantiates the expectations for a new bearish correction. Moreover, the rebound from the ascending channel's upper boundary represents yet another confirmation of the rapidly rising bearish pressure. Overall, the confluence of underlying evidence seems to suggest that the establishment of the broader uptrend is likely to be temporarily put on hold.
The implementation of contrarian trading strategies is highly unadvisable due to the low levels of liquidity and the massive levels of uncertainty. As was mentioned in today's 'Weekly Expectations' segment, the overall trading activity is going to be greatly diminished today and probably tomorrow due to the Columbus Day celebrations in North America. Such an environment would likely result in the aforementioned reduction of overall liquidity, which, in turn, would increase the associated risk from shortening gold at present considerably.
A more suitable approach to utilising the underlying setup would entail the implementation of trend-continuation trading strategies once the anticipated correction bottoms out. In other words, traders could look for opportunities to enter long on the broader bullish trend once there are clear indications that the price action has found strong support.
This could potentially happen in one of two possible areas. On the one hand, there is the major support at 1920.0, which has solidified its role as a prominent turning point on several occasions. A sustained consolidation around this level would likely imply an end to the currently emerging bearish correction.
On the other hand, the price could fall as low as the bottom boundary of the ascending channel before it rebounds. The channel's lower edge has only recently crossed above the psychologically significant support at 1900.0, which makes it an even stronger support.
In conclusion, traders should be patient and wait to see how the price action behaves next. Once the underlying liquidity levels in the market return to normal, trading would be justified. They could implement trend-continuation strategies once the bearish correction has reached a solid support.
Can the Bulls Retail Control?
The Gold December Futures expectedly found support around the psychologically significant level at 1900.0, as per our earlier projections. The underlying bullish sentiment is gradually rising, as the price attempts to penetrate back within the territory of the ascending channel (see the chart below). The price action currently finds itself at a crucial junction, and its immediate behaviour is going to elucidate its next likely direction.
As regards the prevailing fundamental factors in the market, little has changed in the last several days. Coronavirus cases continue to surge across Europe and North America, which has prompted intensified talks of a likely reintroduction of more stringent containment measures. Certainly, this is nothing new, so talks of a second epidemic wave do not bear the same shock value the initial wave in Q1 had; however, these recent developments are indeed going to unnerve the global capital markets.
What the state of the global pandemic would be in one, two or more months is anybody's guess, but one thing can be asserted with relative assuredness – the uncertainty emanating from the pandemic continues to be weighing down on investors' sentiment. Consequently, the demand for low-risk safe-havens is not waning and has indeed accelerated over the last several weeks. A direct correlation between the number of global COVID-19 cases and the demand for gold futures can therefore be inferred, whereas a surge in the former would more than likely prompt a boost in the latter.
Most epidemiologists seem to agree that the second wave would accelerate over the winter months in Europe and North America, as more people stay indoors with poor ventilation, something that makes the spread of the virus easier. Such developments were already observed in Australia in July and August (winter months in the Southern Hemisphere). It follows that the demand for gold futures is probably going to increase by the end of the year, as investors seek to hedge themselves against the expected rise in overall uncertainty.
All of this is inclined with the longer-term forecasts relating to the price of gold futures. Nevertheless, it should also be stated that the secondary consequence of heightened uncertainty is bolstered volatility. In particular, the price action of gold futures could also become quite erratic and turbulent, as the fear factor of investors' actions becomes more pronounced. Moreover, the presidential elections in the US are likely to exacerbate this trend, further rising the overall uncertainty factor.
That is why the bulls should be especially cautious when deciding to join the underlying bullish trend. Even though the price action is expected to go north by the end of the year, there is a high degree of risk associated with adverse volatility potentially wiping out long orders with poor entries.
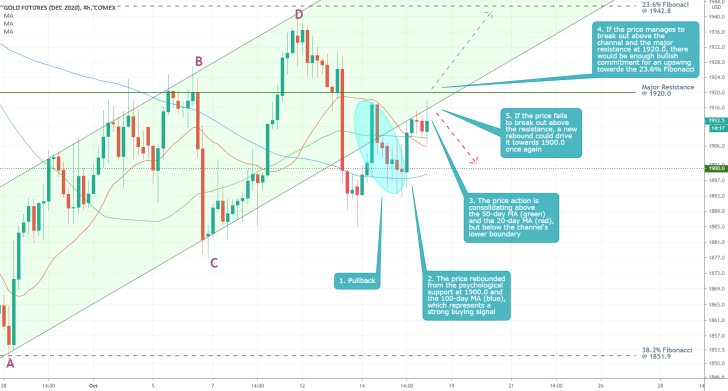
As regards the technical outlook, the 4H chart above confirms the longer-term expectations for sustained price appreciation. Chiefly, the recent breakout above the psychologically significant resistance at 1900.0, in addition to the rebound from the 100-day MA (in blue), represent a substantial confirmation of the underlying bullish sentiment. Even still, the price action is currently consolidating between the two remaining moving averages – the 50-day MA (in green) and the 20-day MA (in red) – and the lower boundary of the ascending channel.
The manner in which this temporary consolidation is concluded would elucidate the next likely direction for the price of gold. On the one hand, a breakout above the major resistance at 1920.0 would mean that the last barrier for the bulls would have been broken, which, in turn, would mean that the upswing would be free to continue advancing towards the 38.2 per cent Fibonacci retracement level at 1942.8 uninterrupted. On the other hand, a rebound from the channel's lower boundary would mean that the bears still retain some control over the price action and that the subsequent correction would potentially drive the price action towards the psychological support at 1900.0 once again.
At any rate, both bulls and bears should observe how the price action behaves next around these crucially important resistance levels.
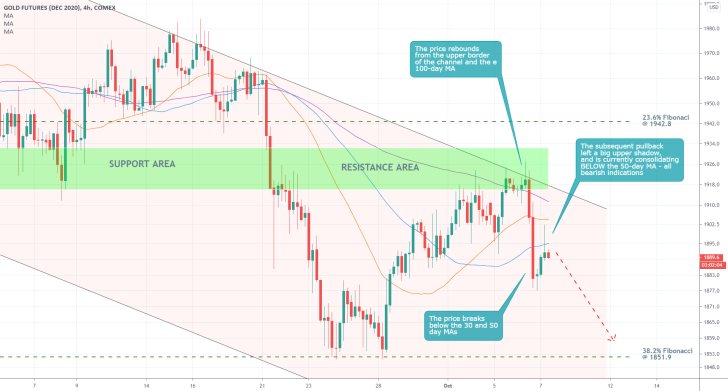
- A selling order is opened at the current market price (1889) on the December gold futures. The price recently broke down below the three MAs on the chart, and the subsequent bullish pullback appears completed. The price is expected to head towards the support at 1851 next.
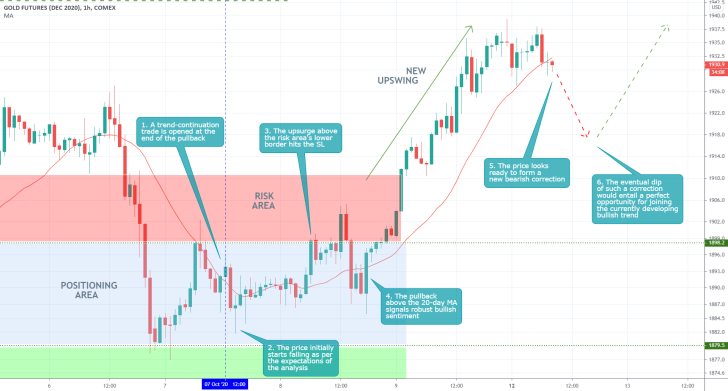
- There were strong indications that the market would continue heading lower in the immediate future, so opening a short order at the end of the minor bullish pullback was justified. However, shortly afterwards, the bearish sentiment started diminishing rapidly. The breakout above the risk area means that selling is no longer desirable. Instead, traders need to look for opportunities to buy into the currently evolving uptrend, as per the long-term projections of the analysis, once the market establishes a bearish correction.
- The anticipations for such a correction are substantiated by the fact that the price action has recently broken down below the 20-day MA for the first time since the beginning of the upswing's development.
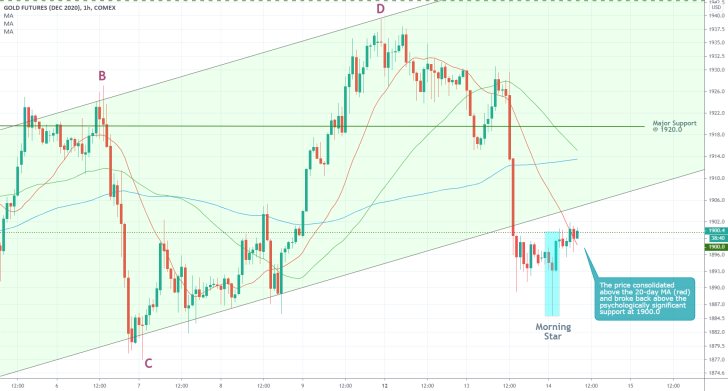
- The expectations for the formation of a bearish correction on the price of the December Gold Futures, which were projected in the last follow-up, are already being realised. As can be seen on the hourly chart above, the price action temporarily broke down below the ascending channel yesterday but has since then made a considerable recovery. In particular, the price action established a 'Morning Star' pattern in the early hours of Wednesday, which is a pattern that typically entails rising bullish sentiment. Furthermore, the price reverted itself back above the psychologically significant support level at 1900.0, which is a prominent turning point; and has consolidated above the 20-day MA (in red).
- Even though these developments should not be taken necessarily as buying signals, they could be interpreted as early pieces of evidence signifying the conclusion of the bearish correction, which was the primary focus of the follow-up. In other words, there are mounting pieces of evidence signalling a likely termination of the bearish correction in the near future, which could be used by the bulls for the implementation of trend-continuation trading strategies.
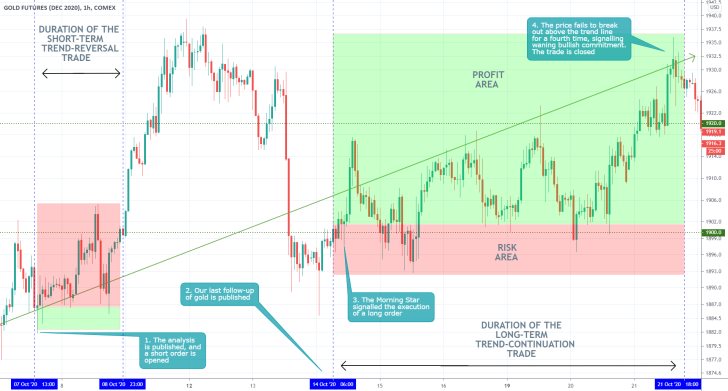
- The longer-term expectations of the initial analysis of the December gold futures were finally realised yesterday. As can be seen on the hourly chart above, the trend-continuation trade was closed yesterday following the fourth failed attempt at a decisive breakout above the ascending trend line. This does not necessarily mean that the underlying bullish sentiment is completely exhausted, but possibly that a new bearish correction might be due now that the price action nears the previous swing high.
- We are going to continue monitoring the situation as it develops, anticipating the underlying bullish sentiment to remain prevalent by the end of the year.
Disclaimer: Your capital is at risk! Trading and investing on the financial markets carries a significant risk of loss. Each material, shown on this website, is provided for educational purposes only. A perfect, 100% accurate method of analysis does not exist. If you make a decision to trade or invest, based on the information from this website, you will be doing it at your own risk. Under no circumstances is Trendsharks responsible for any capital losses or damages you might suffer, while using the company’s products and services. For more information read our Terms & Conditions and Risk Disclaimer.


