With less than a month remaining before the pivotal election, the US equity market currently seems to find itself at a crucial make-it-or-break-it juncture. With so many different factors affecting the stock market at present, a catalyst for the next big directional movement could come from any direction.
Donald Trump's recent decision to postpone the talks concerning the highly anticipated fiscal stimulus package for after the election is weighing down on most indices. Meanwhile, the uptick in global COVID-19 cases has worried investors, as Governments are now likely to reintroduce the stringent containment measures that had such an adverse impact on the global economic activity in the first two quarters of the year.
Additionally, the latest earnings season began this week, with prominent financial institutions reporting today and tomorrow. Traders would be looking to the reports of Bank of America, Wells Fargo, Goldman Sachs, and Morgan Stanley (reporting tomorrow) for any glimmers of hope. Chiefly, they would be hoping to see indications that these financial powerhouses' quarterly performance could sustain the stock market rally in the near future. At present, investors are looking for any reasons to believe that the stock market could weather the anticipated surge in volatility around the time of the election.
With all of that in mind, the next following days are likely to crystallise the future of the stock market for the remainder of Trump's days at the White House, until the next inauguration date at least. That is why today's analysis carefully scrutinises the current state of the S&P 500 index and determines its next most likely direction.
1. Long-Term Outlook:
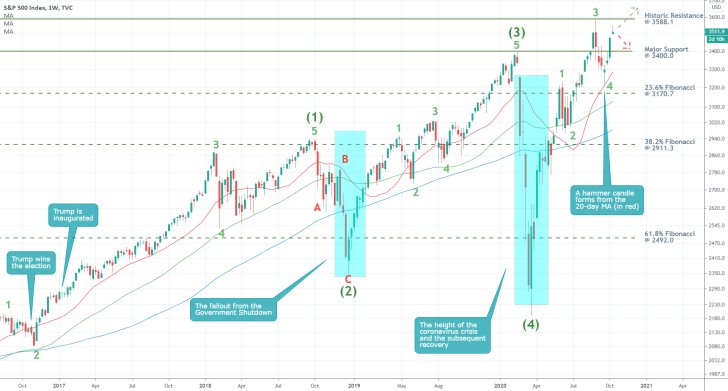
The S&P 500 has been advancing for the better part of Trump's presidency and has broken many records since his inauguration. Even still, two major collapses underpin the biggest tribulations that the stock market had to withstand over the last three years. Primarily, the Government shutdown of late-2018 and the coronavirus crisis of 2020.
These two massive dropdowns generated the two retracement legs comprising an even broader 1-5 impulse wave pattern, as postulated by the Elliott Wave Theory. As can be seen on the weekly chart below, the price action is currently in the process of establishing the final impulse leg (4) – (5) of this grand cycle. The leg itself has so far completed two minor impulses at 1 and 3, and two minor retracements at 2 and 4 (as seen to the right of (4)).
All of this implies that the price action is likely to attempt breaking out above the historic resistance level at 3588.1 in the next several weeks; however, the aforementioned expectations for volatility outbursts leading up to the election could cause temporary fluctuations towards the major support at 3400.0.
2. Short-Term Outlook:
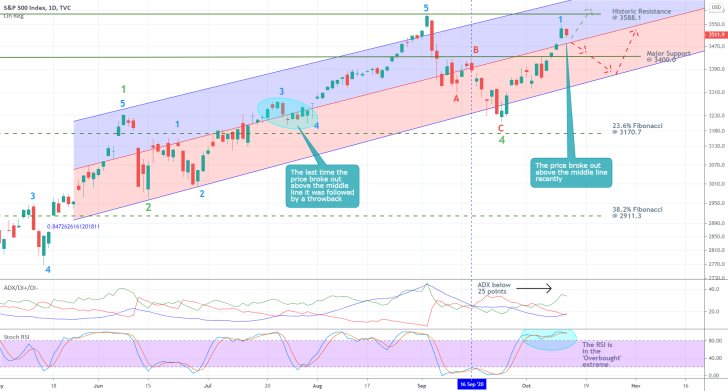
There are several key developments in the short-term that require closer attention. Firstly, the ADX indicator has been threading below the 25-point benchmark since the 16th of September, which implies the existence of range-trading conditions on the market at present. Secondly, the Stochastic RSI indicator has been threading in the 'Overbought' extreme over the last several days.
When these two factors are considered together, they underscore the heightened probability for the emergence of a bearish correction in the near term before the development of the broader uptrend can be resumed.
Unless the price action resumes heading north right away, there are several areas where the anticipated bearish correction could fall to in the near future. The first is encompassed by the middle line of the ascending channel; the second is represented by the major support level at 1400.0, which has psychological significance; and the last one is encapsulated by the channel's lower boundary.
Notice also that the last time the price action was consolidating around the middle line of the channel, it took several days and a false breakdown before the price action resumed developing the broader directional swing that was prevailing at the time. In other words, similar behaviour is likely to be observed once again, seeing as how the price action is attempting to complete another upswing towards the channel's upper limit.
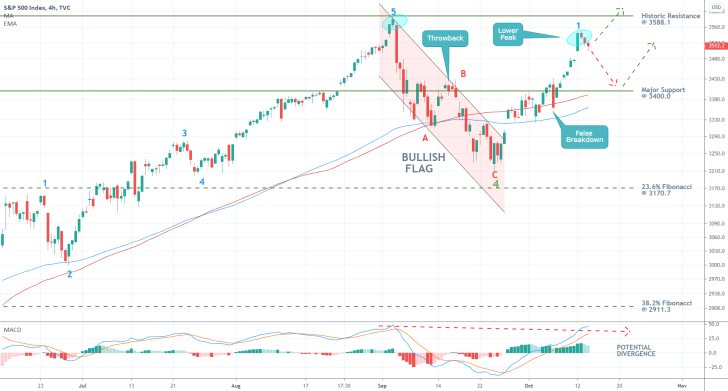
As regards the 4H chart below, even more pieces of evidence confirming the bearish expectations in the short-term can be observed. Chiefly, yesterday's price action established a peak that is lower than the one preceding it – the first and last time the price tested the resistance at 3588.1. Consequently, the price action would be more likely to continue falling towards the next support unless the market does not immediately go north.
Meanwhile, the underlying market momentum remains ostensibly bullish; however, the potential formation of a divergence in the immediate future would further increase the likelihood for the creation of a bearish correction.
It is worthwhile noting that the 100-day MA (in red) and the 100-day EMA (in blue) are currently converging towards the major support level at 3400.0, which makes the latter an even more prominent support. Hence, the anticipated surge of bearish pressure is likely to be tested around this level, which means that a reversal is likely to take place around it.
3. Concluding Remarks:
The underlying setup entails the implementation of swing trading strategies. The price action would either develop a minor correction, which would allow the bulls to join the existing trend somewhere around the 3400.0-3450.0 area, depending on where the price finds support next; or conversely, the S&P would shoot up immediately. In the latter case, traders would have to remain patient and momentarily refrain from joining the market, because opening long orders close to the all-time high would be a mistake.
End of the Correction, the Bulls Take Charge
The S&P 500 is once again looking increasingly hawkish. Following the publication of our last analysis of the index earlier this week, the price behaved almost exactly as expected. Initially, the stock index fell as part of the establishment of a minor bearish correction. The latter seems over now, which clears the way for the bulls to step-up once again and drive the price further north.
As regards the recent fundamental developments, American stocks rose during today's session on the better-than-expected retail sales for September. The robust sales numbers imply strong recovery, which is for the time being unimpeded by the electoral tribulations in the States.
Stocks are likely to continue advancing next week and test the historic resistance level at 3588.1; however, unexpected developments over the weekend could potentially prompt the index to open with a gap on Monday morning. That is why traders should be especially cautious if they plan to open any long orders at the end of this week's trading session.
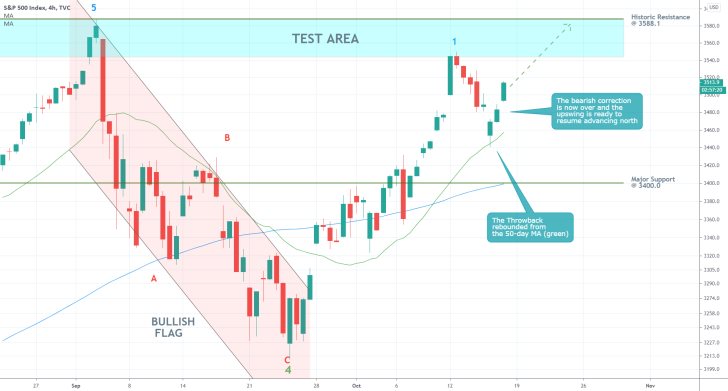
As regards the current technical outlook, the recent behaviour of the price action is demonstrative of the robust bullish bias in the short term. The rebound from the 50-day MA (in green) represents the most substantial piece of evidence of the reinstated bullish momentum.
The bearish pullback from point 1, the likelihood of which was underpinned in the last analysis, is now decidedly terminated, which is what confirms the expectations for sustained appreciation in the near future.
New potential rebounds could form once the price action penetrates the 'Test Area', which represents the last significant barrier before the index goes into uncharted territory (above 3588.1). That is so because of the impact of mass-market psychology - one can expect the execution of multiple selling orders around this historic resistance by traders looking to 'cash in' before the index goes for new records.
This is, of course, conjecture and may not be realised at all. Nevertheless, it is worthwhile for traders to prepare for adverse fluctuations as the price action nears the resistance at 3588.1.
The S&P 500 Swept Away by the Changing Tide
A lot has changed for the S&P 500 since our previous analysis of the index. Despite the solid retail sales data and durable goods orders for September, which bolstered the strength of the greenback, the American economy continues to reel from the renewed threat of the pandemic.
American stocks tumbled today as the global uptick in confirmed COVID-19 cases is rising relentlessly, which would most likely compel many governments to tighten their containment measures once again. Meanwhile, Donald Trump's decision in early-October to postpone the stimulus negotiations for after the election now looks poised to backfire in a major way.
The widening gap between FED's accommodative monetary policy and the lack of a corresponding fiscal policy could jeopardise the economic recovery in the US, which is a scenario that is posing a rising threat for the stock market.
While this discrepancy between MP and FP is allowed to persist, given the deteriorating epidemic circumstances in the US and elsewhere, the stock market would not be able to recuperate. Moreover, the market finally looks ready to acknowledge the fact that the recent stocks rally could not be extended indefinitely while the possibility of another economic downturn remains prevalent. In other words, the stock market rally can no longer outstrip the moderate growth pace of the economy.
As regards the current fundamental outlook, the S&P 500 looks poised to continue depreciating in the near term, similar to European stocks.
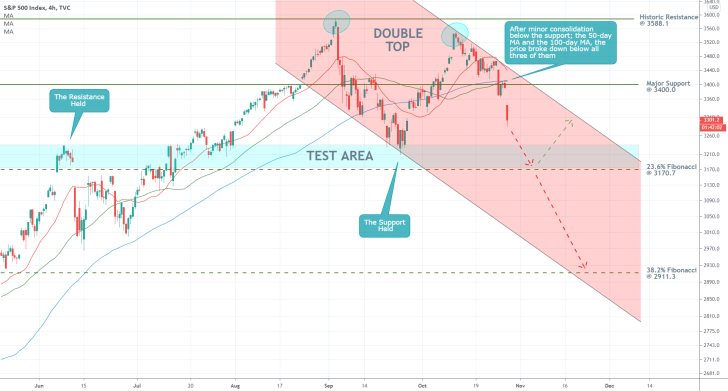
As regards the current technical outlook, in the aftermath of today's major turmoil, the S&P 500 made one crucial development for the future establishment of a new markdown. The price action broke down conclusively below the major support (now resistance) level at 3400.00, in addition to closing down below the 100-day MA (in blue); the 50-day MA (in green); and the 20-day MA (in red). Unless there is an immediate pullback, this behaviour of the price action illustrates the likely continuation of the downtrend's development in the near future.
The next most likely target level for set downtrend is encapsulated by the psychologically significant 23.6 per cent Fibonacci retracement level at 3170.7. Notice that the Test Area just above it has already served the role of a prominent turning point on two separate occasions in the past, which looks bound to test the strength of the current bearish commitment in the market.
If the price action breaks down below the 23.6 per cent Fibonacci as well, then it could be expected to resume falling towards the lower boundary of the descending channel, which would likely be converging towards the 38.2 per cent Fibonacci retracement level at 2911.3 by that time.
Traders looking to join this developing downtrend should be especially careful. At times when the stock market plunges, the underlying liquidity levels tend to drop drastically as well. Consequently, the process of getting in and out of trades could be impeded. Imprecise trade execution could cost dearly for traders looking for maximum efficiency.
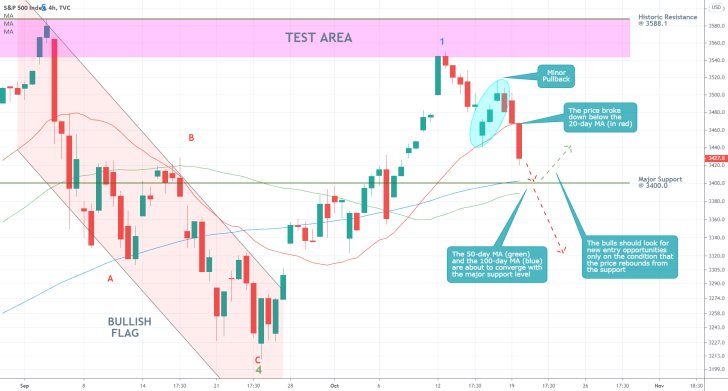
- Since our previous follow-up on the S&P 500, the price action established a false rebound (the pullback area in light blue), which was followed by a breakdown below the 20-day MA (in red). The price action is currently headed towards the major support level at 3400.0, which is the next likely contented for the establishment of a reversal. Notice that the 50-day MA (in green) and the 100-day MA (in blue) are both converging towards the latter, which increases the likelihood of a rebound at set level.
- The market bulls can utilise the opportunity in one of two ways. They could place a long limit order around the 3400.0 level with a very narrow stop-loss, utilising proactive trading strategies. Conversely, more risk-averse traders could wait for definitive signs of a rebound from the support level before they place long market orders using reactive trading strategies. The former scenario bears a higher degree of risk because the dropdown could potentially extend beyond the support, whereas the latter would entail lower potential profits.
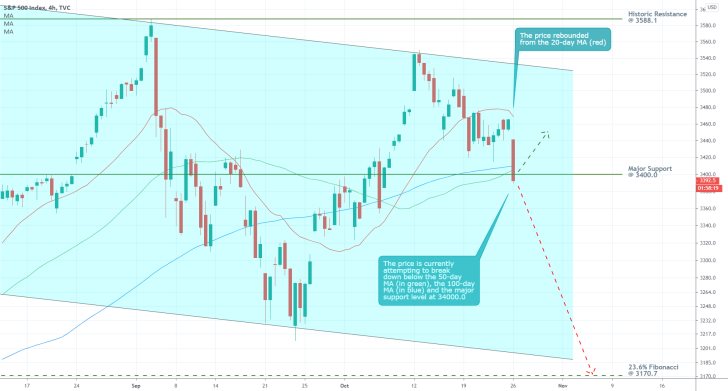
- The price action of the S&P 500 has changed directions since our last follow-up on the index. As can be seen on the 4H chart above, the price action rebounded from the 20-day MA (in red) before today's attempt at a decisive breakdown below the major support level at 3400.0, which is currently converging towards the 50-day MA (in green) and the 100-day MA (in blue).
- If the price action does manage to break down below the three definitely, then the next target level for the newly emerging downswing would be the descending channel's lower boundary towards the 23.6 per cent Fibonacci retracement level at 3170.7. Conversely, a rebound from the 3400.0 level at the present rate could test the strength of the 20-day MA (in red) once again. The biggest takeaway from this setup is that the behaviour of the market could change at any rate. Traders should be level-headed enough to recognise these changes as they occur and adjust their approaches to trading accordingly.
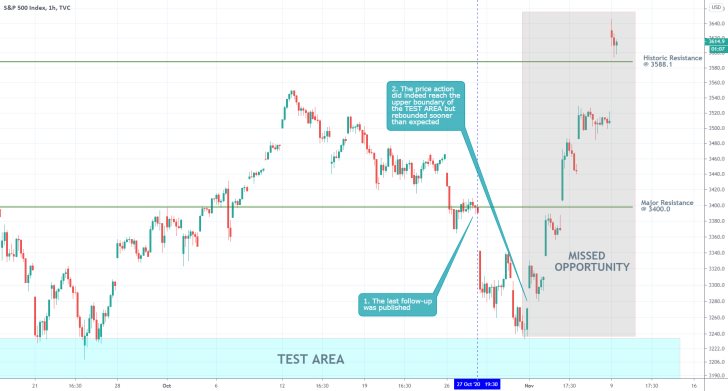
- Even though the price action of the S&P 500 behaved mostly as expected by the last follow-up, and indeed it dropped almost perfectly to the projected support, the trade is conserved an overall failure. That is so because of poor timing and relatively late suggestion for contrarian trading in a trending market. That is why the Missed Opportunity outweighs the potentially accumulated minor profits. Even if a trader spots an opportunity for contrarian trading in a trending market environment, it is better to sit and wait if the market has already started establishing such a correction, rather than joining the market late.
- Also, the price action surged today on the welcoming covid-19 vaccine news, which underpins the impact of unforeseeable market developments.
Disclaimer: Your capital is at risk! Trading and investing on the financial markets carries a significant risk of loss. Each material, shown on this website, is provided for educational purposes only. A perfect, 100% accurate method of analysis does not exist. If you make a decision to trade or invest, based on the information from this website, you will be doing it at your own risk. Under no circumstances is Trendsharks responsible for any capital losses or damages you might suffer, while using the company’s products and services. For more information read our Terms & Conditions and Risk Disclaimer.


