The EURAUD pair recently reached a new significant bottom, which measures the lowest point in the current bearish trend (lowest point so far). This bottom coincides with one major support level, which gives credence to some expectations for a trend reversal and the establishment of a new bullish upswing.
The ECB and the EU Commission recently ramped up their monetary and fiscal policies respectively, which is anticipated to boost the strength of the Euro as the economy of the Eurozone gradually recovers from the coronavirus-triggered downturn. Meanwhile, the Australian economy is also showing signs of stabilisation, however, it also continues to reel from the enormous strain of the coronavirus fallout.
That is why, in today's analysis, we examine the prospects for the formation of a trend reversal pattern on the price action of the EURAUD pair. We are going to outline all of the crucial test levels, which need to be broken in order for the existence of a new bullish trend to be confirmed. Consequently, these same levels could serve as potential entry points for market bulls.
1. Long-Term Outlook:
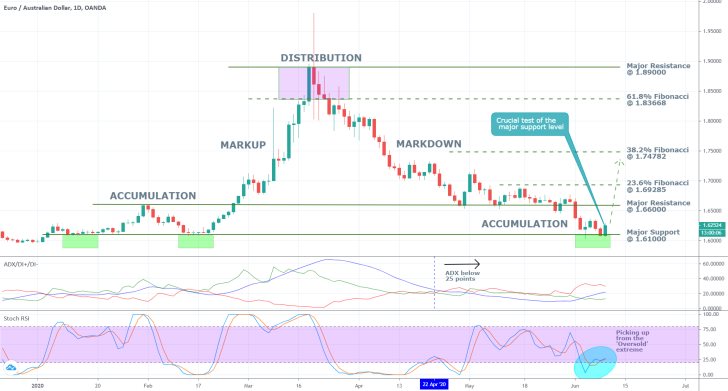
As can be seen on the daily chart below, the EURAUD is currently trading within the boundaries of a significant Accumulation range. Its upper edge is represented by the major resistance level at 1.66000, whereas the major support level at 1.61000 encompasses the range's lower limit. Notice that the latter served as a lower boundary for the previous Accumulation range as well, which gives it prominence as a potential turning point for the underlying direction of the price action.
Market bulls would be betting precisely on the formation of a likely trend reversal from this major support level, which could, therefore, underpin the beginning of a new bullish trend. Such a turn of events is going to be supported by the aforementioned fundamental factors.
Evidently, the first major obstacle for a newly developing uptrend is going to be breaking out above the Accumulation range's upper boundary. Subsequently, the price action would have to break out above the 23.6 per cent Fibonacci retracement level at 1.69285 and the 38.2 per cent Fibonacci retracement level at 1.74782. Conversely, the price action could consolidate within the Accumulation range in case it fails to break out above the first major obstacle.

The ADX continues to be threading below 25 points (this has been the case since 22nd of April); however, it has been on the rise over the last several days. This means that the price action is becoming more volatile, which is a necessary precursor for a breakout play and the transition of the underlying market sentiment from being prevailingly range-trading to trending.
The Stochastic RSI indicator has recently risen from its 'Oversold' extreme, which is a favourable development for the emerging bullish commitment in the market. This also is needed for the establishment of the aforementioned breakout above the Accumulation range's upper boundary.
2. Short-Term Outlook:
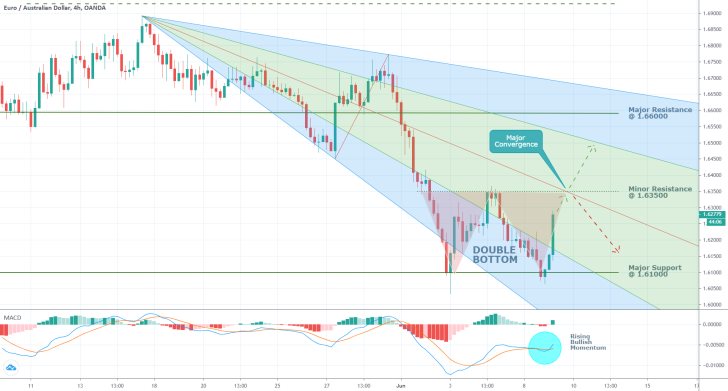
As can be seen on the 4H price chart below, the termination of the bearish trend is likely to take the shape of a Double Bottom pattern. These are commonly found at times when an existing bearish downtrend reaches a new dip, which signifies its termination. Hence, if the price action manages to break out above the minor resistance level at 1.63500, which serves as a 'Neckline' for the Double Bottom pattern, this would signify the termination of the preceding bearish trend and the likely emergence of a new bullish trend from it.
Notice that the Neckline of the pattern coincides with the pitchfan's middle line, which bolsters the significance of the resistance level. This, in turn, would make it even more difficult for the underlying price action to manage a successful breakout above 1.63500. Accordingly, if the price action manages to break out north of the pivotal test level successfully, this is going to represent significant confirmation of the underlying bullish commitment's strength.
Thereby, the price action could either conclude the establishment of the Double Bottom pattern and subsequently head towards the major resistance level at 1.66000, or it could fail to do so. Consequently, the EURUSD is likely to consolidate within the lower part of the pitchfan tool – between the minor resistance level at 1.63500 and the major support level at 1.61000.
At present, the MACD underlines the rising bullish momentum in the market, which favours the former scenario.

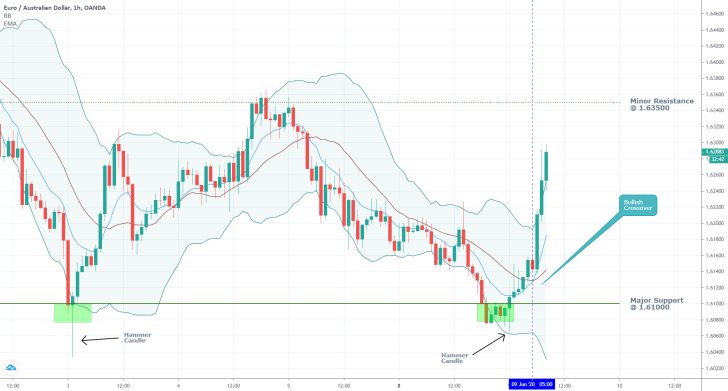
The hourly chart below highlights in greater details the lowest points of the two corresponding bottoms. As can be seen, both dips are represented by hammer candlesticks, which signify the increases of bullish commitment in the short run. This, in turn, is favourable for a likely breakout above the minor resistance level at 1.63500.
The widening Bollinger Bands (BBs) below confirm the aforementioned assertion regarding the rising volatility in the market. Hence, the behaviour of the indicator represents yet another indication of mounting bullish commitment in the market, which favours a breakout further north.
Finally, notice that earlier today (05.00 am CET), the 10-day EMA (in blue) crossed above the middle line of the BBs. This, too, is indicative of mounting bullish pressure in the short run and favours the continuation of the price action's trading above the minor resistance level at 1.63500. For as long as the following relationship is preserved – the price action continues to trade above the 10-day EMA, which continues to trade above the BBs' middle line – the bullish commitment in the market would be preserved. Hence, market bulls can use this insight to determine their favourable entry points.

3. Concluding Remarks:
At present, there is a confluence of various underlying data seemingly suggesting that the EURAUD's bearish trend, which was prevailing since late-March, is all but exhausted. This is welcoming news for contrarian traders (market bulls in this case), who will be looking for confirmations of their anticipations for a trend reversal so that they can execute long orders at the outset of a new bullish trend's development.
Depending on whether or not the market concludes the establishment of the aforementioned Double Bottom pattern, such a trend reversal can either be confirmed or dismissed.

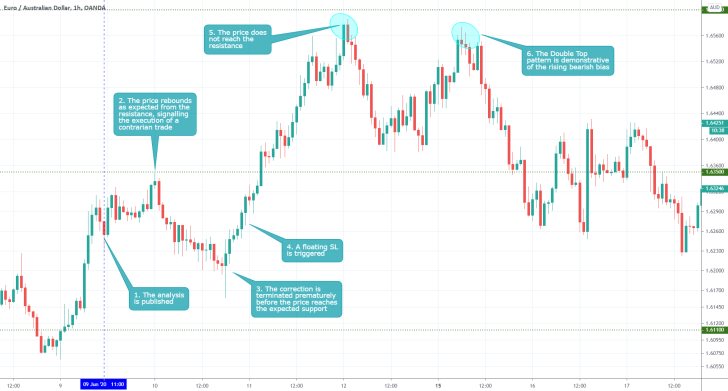
- The analysis correctly argued that the preceding bearish trend was concluded by the time the analysis was published. Nevertheless, the longer-term expectations of the analysis were not realised, as the price action went on to establish a new range as opposed to the anticipated uptrend. The price action was notably reversing its course each time it came close to a prominent support and resistance level, which is a significant piece of evidence demonstrating the existence of range-trading bias in the market.
Disclaimer: Your capital is at risk! Trading and investing on the financial markets carries a significant risk of loss. Each material, shown on this website, is provided for educational purposes only. A perfect, 100% accurate method of analysis does not exist. If you make a decision to trade or invest, based on the information from this website, you will be doing it at your own risk. Under no circumstances is Trendsharks responsible for any capital losses or damages you might suffer, while using the company’s products and services. For more information read our Terms & Conditions and Risk Disclaimer.


