The price of the Nasdaq composite recently started developing a new bearish correction, as was forecasted by our previous analysis of the index. Even still, the broader rally still looks quite solid, which means that bulls can look for an opportunity to enter long at the bottom of the correction by implementing trend continuation strategies.
While there wasn't a single comprehensive catalyst for the dropdown, a bundle of contributing factors led to the sizable dive. For one, the pace of the global economic recovery is surpassing the preliminary forecasts, which is why uncertainty diminished over the last several weeks. Because of that, more and more central banks are becoming increasingly more hawkish in their policy statements, hinting at an eventual dialling back of their quantitative easing programmes.
It was precisely the massively accommodative monetary policy stance of the FED that served as the primary cause of Nasdaq's rally in the wake of the initial coronavirus crash. Yet, the impact of FED's liquidity-pumping programmes is likely to have an increasingly smaller imprint on the rally of the Nasdaq. That is why the current correction could be extended even lower before it eventually bottoms out.
The end of the correction would likely spell the normalisation of the stock market, meaning that regular economic data is likely once again to become the benchmark of growth in the stock market. This week's inflation and retail sales numbers could be just that, potentially causing another bullish rebound on the index's price action. The strengthening U.S. dollar could contribute to that as well.
That is why bulls should look for signs of consolidation around the closest support level while bears could potentially try to squeeze the maximum out of the rest of the correction. However, it should be stated that such contrarian trading would entail a high degree of risk.
Breaking the Regression Channel
As can be seen on the daily chart below, the correction commenced as the price action managed to close down below the middle line of the regression channel. And even though the last couple of trading days started with positive gaps, the underlying sentiment is ostensibly bearish.
The first major target for the correction is encapsulated by the psychologically significant resistance-turned-support level at 15000.00. The latter serves as a major turning point. Moreover, it was recently crossed by the 20-day MA (in red), which makes it an even more significant threshold.
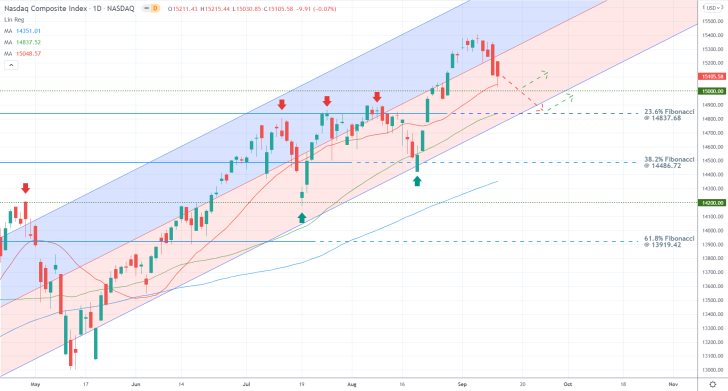
If the dropdown manages to penetrate below the latter, however, it could then be extended towards the 23.6 per cent Fibonacci retracement level at 14837.68. It had previously served as a major resistance level, causing the price action to reverse from it on three separate occasions. This is what makes it another prominent turning point.
Not only that, but the 23.6 per cent Fibonacci is currently converging with the 50-day MA (in green), which represents yet another floating support. Finally, the lower limit of the regression channel is also crossing the 14837.68 level at the present moment. This convergence of these three major supports is why the correction is likely to bottom out there.
Bears can weigh in on the probability of a dropdown to the 23.6 per cent Fibonacci, while bulls can prepare to go long at either one of the two targets for the end of the correction.
Examining the Correction in Greater Detail
The correction commenced after a Hanging Man candle on the 4H chart was followed by the emergence of a Shooting Star. Both of these types of candlesticks indicate upcoming bearish reversals, which is why their development here means that the correction is likely to be extended lower in the near future.
This assertion is further substantiated by the fact that the underlying bearish momentum is growing steadily, as underpinned by the MACD indicator.
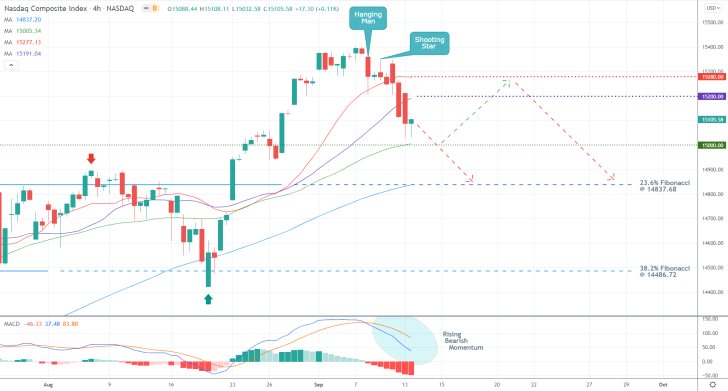
However, due to the close proximity of the psychological support at 15000.00, some adverse fluctuations are also likely to occur over the next several days. On the one hand, bears who join the market at the current spot price could suffer from adverse rebounds to the 30-day MA (in purple) at 15200.00 or the 20-day MA (in red) at 15280.00.
On the other, bulls who enter prematurely around the same support, which is currently converging with the 50-day MA, could suffer from the possibility of a deeper correction to the 23.6 per cent Fibonacci. That is why both should be cautious and patient.
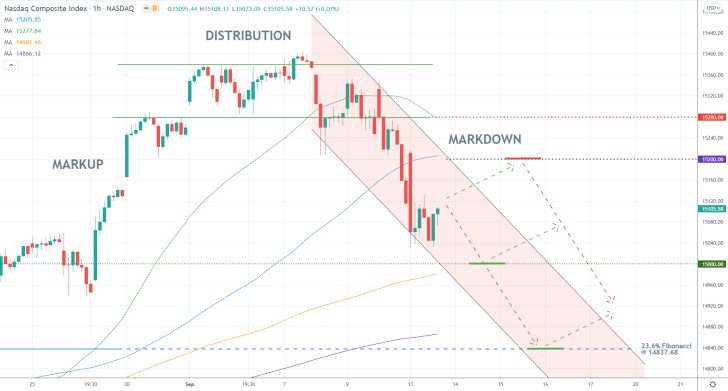
It is interesting to point out that in the very short term, the price action is behaving under the expectations of the Wyckoff Cycle Theory, which means that the underlying correction functions as a minor Markdown, which followed a breakdown below the lower boundary of the last Distribution range.
What this entails is that the correction can be said to be over once the price action manages to penetrate above the boundaries of the descending channel decisively. Depending on their level of risk-aversion, bulls and bears can trade this setup in two different ways.
Concluding Remarks
Bears can negate the risk of selling so close to the psychological support at 15000.00 by waiting for a potential upswing to the 100-day MA (in blue), as seen on the hourly chart, at 15200.00. If they see that the price action is incapable of breaking out above this major support-turned-resistance, only then would it be prudent for bears to execute a contrarian position to either one of the two aforementioned targets.
Bulls, in contrast, can place a long limit order at the 23.6 per cent Fibonacci and monitor the behaviour of the price action around 15000.00. If they see that the price action consolidates above the latter without being able to break down below it, they can then place a long market order around it. In either case, they shouldn't place their stop-loss orders more than 100 basis points away from the initial entry.
Can the Nasdaq Consolidate Above 15000.00?
Following the emergence of a massive fakedown last week, which was forecasted by our previous analysis of the index, the price of the Nasdaq composite managed to recuperate. It rebounded and is currently consolidating around the psychologically significant resistance-turned-support level at 15000.00. The question is whether the price action would manage to remain above this psychological threshold, or is it bound to form a new dropdown?
There aren't many top-tier economic events in the calendar for this week that seems likely to stir any surprises on the index, which is why the current pullback could be extended higher. However, with the third-quarter earnings season just around the corner, the volatility levels are likely to start increasing over the next several weeks.
That is why bulls would be looking for a chance to utilise trend continuation trading strategies, whereas bears would be looking for early signs of a decisive bearish reversal.
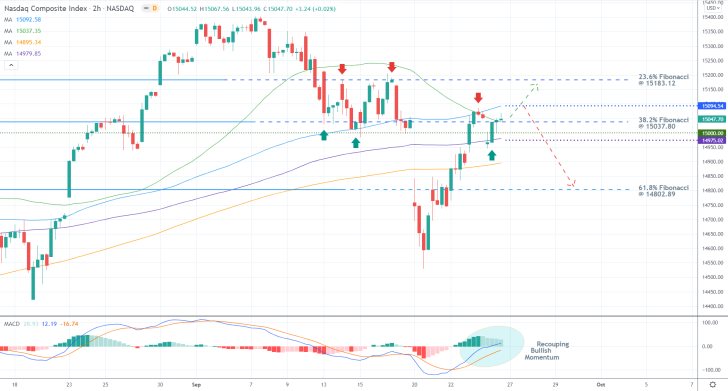
As can be seen on the 2H chart above, the perfect ascending order of the four moving averages, which illustrates strong bullish sentiment, is almost intact, with the exception of the 50-day MA (in green).
The latter recently crossed below the 100-day MA (in blue), which signifies heightened bearish pressure in the short term. In contrast, the MACD indicator continues to convey rising bullish momentum.
The price action is currently strengthening above the 150-day MA (in purple), which underpins the 14975.00 support level, and the psychological support at 15000.00, converging with the 50-day MA. Additionally, the price action is concentrated below the 100-day MA, which has turned from a floating support to a floating resistance. Most notably, last week's trading session closed at the 38.2 per cent Fibonacci retracement level at 15037.80, which is in itself a major turning point.
All of this creates a sort of a bottleneck characterised by diminished volatility. Such behaviour of the price action can be expected at times when trading activity tends to decrease momentarily, usually before the development of a new massive upswing or downswing. This means that both bulls and bears could look for an opportunity to join the market once this bottleneck gets broken.
As regards the current opportunities for bulls, they can look for an opportunity to join the market after today's open, provided that the Nasdaq does not open with a massive gap. If today's session opens around the 38.2 per cent Fibonacci, bulls can place their stop-loss orders just below the 150-day MA, eyeing a potential upswing towards the 23.6 per cent Fibonacci.
Bears, in contrast, can sell the Nasdaq if the price action reverses from the 100-day MA at 15094.54. They can place their SLs no more than 30-40 basis points above their initial entries. The primary target for bears is encapsulated by the 61.8 per cent Fibonacci at 14802.89.
Nasdaq's Selloff Likely Not Yet Over
U.S. tech stocks have been falling since late September, as was anticipated by our previous analysis of the Nasdaq Composite. Multiple contributing factors have prompted the upsurge of selling pressure, primarily the global energy squeeze and tentative recovery.
The underlying market sentiment remains mostly undecided as the U.S. dollar's recovery was put on a temporary halt. This is owing to diverging indications of global recovery. On the one hand, labour market conditions are improving, though slower than initially anticipated. On the other, the overall economic sentiment continues to falter.
This creates a global environment dominated by uncertainty, which is why stocks are likely to continue falling over the near future. Meanwhile, the highly anticipated U.S. inflation data for September, which is scheduled for publication later today, could either strengthen or weaken the Nasdaq's selloff.
Under these conditions, bears can try to implement trend continuation trading strategies in order to take advantage of the probable continuation of the dropdown further down south.
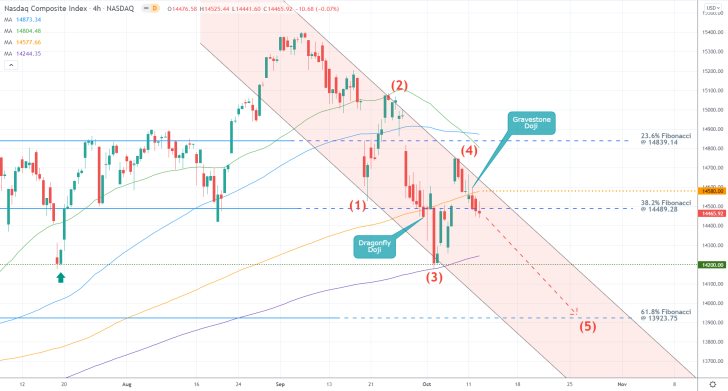
The selloff is represented on the 4H chart above as a descending channel. Moreover, it appears to take the form of a 1-5 impulse wave pattern, as postulated by the Elliott Wave Theory. Given that the second retracement (3-4) leg is evidently already completed, the price action is now ready to begin the final impulse leg (4-5).
It is interesting to point out that the second impulse leg bottomed out at the previous swing low (at 14200.00), which had already prompted a bullish pullback once before. Not only that, but the (2-3) impulse leg also rebounded from the 300-day MA (in purple).
The subsequent rebound (the 3-4 retracement leg) was expectedly terminated below the upper limit of the descending channel. Presently, the price action is attempting to strengthen below the 38.2 per cent Fibonacci retracement level at 14489.28 and the 200-day MA (in orange).
The significance of the latter as a major support-turned-resistance (currently at 14580.00) is underpinned by the relationship of the price action around it. The initial Dragonfly Doji followed by the emergence of a Gravestone Doji highlight the shifting roles of the moving average. Bears can use it as a point of reference for their risk management.
Unless a sizable bullish rebound takes place following today's market open, bears can look for an opportunity to sell around the 38.2 per cent Fibonacci. They should place their supporting stop-loss orders just above the 200-day MA.
The next target for the downtrend is once again the previous swing low at 14200.00, which was recently crossed by the 300-day MA. If the price action manages to penetrate below the two, the selloff could then be extended lower towards the 61.8 per cent Fibonacci at 13923.75. The latter is positioned just below the psychologically significant support at 14000.00.
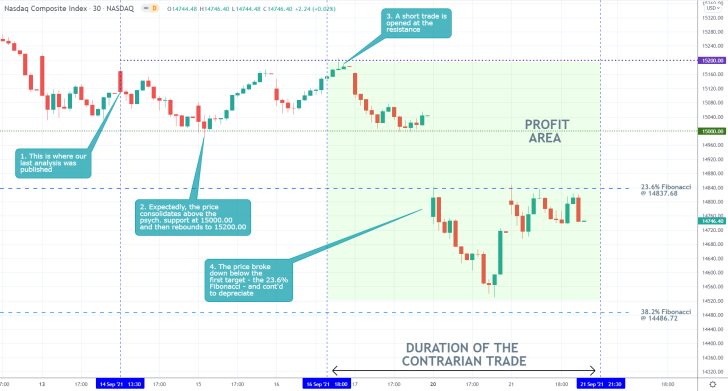
- Our last analysis of the Nasdaq Composite successfully forecasted a rebound from the psychologically significant support level at 15000.00, followed by a reversal from the 15200.00 resistance. The subsequent dropdown penetrated below the first target level at the 23.6 per cent Fibonacci retracement level.
- The short trade garnered more than 450 basis points in profit. However, bulls who placed long limit orders at 14837.68 would have incurred a loss given the continued price depreciation.
- This is a good example of the limitations of trading with limit orders on indices, which are prone to open new days' trading sessions with gaps. The limit orders are ill-equipped to handle such discrepancies in the day-to-day price action.
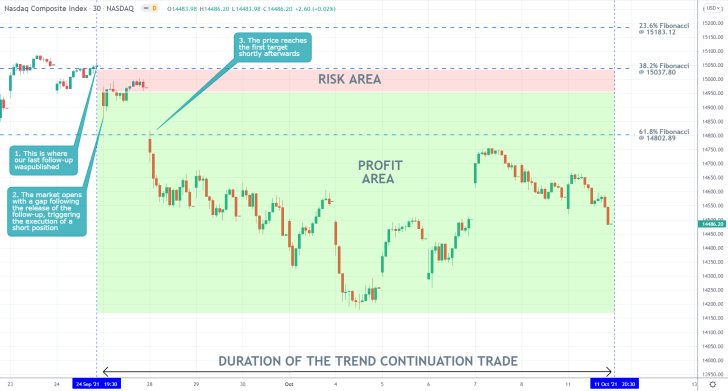
- Our last follow-up analysis successfully forecasted the latest dropdown on the price of the Nasdaq Composite. Shortly after its release, the price action opened the day's session with a gap, which is why a short order was opened instead of a long one.
- The subsequent dropdown reached the first target - the 61.8 per cent Fibonacci retracement level at 14802.89 - almost immediately. This setup is a good example of why using floating TPs sometimes is better than implementing fixed stop orders.
- A floating TP would have squeezed more out of the dropdown below the 61.8 per cent Fibonacci, whereas a fixed order would have been terminated then and there with a suboptimal profit.
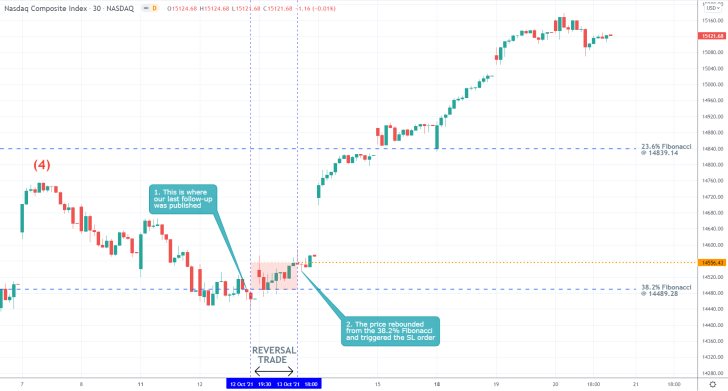
- Shortly after the release of our last follow-up analysis of the Nasdaq Composite, the price of the index continued to consolidate around the 38.2 per cent Fibonacci retracement level at 14489.28.
- A short order was placed on the expectations for the continuation of the broader downtrend further down south. However, the price action rebounded from the Fibonacci and started climbing afterwards.
- Given the prevailing bearish sentiment at the time of the analysis' release, these actions were justified as there were strong indications confirming the expectations for continued price depreciation.
- The narrow stop-loss order (at 14556.43) was quite well-placed as it prevented much bigger losses.
Disclaimer: Your capital is at risk! Trading and investing on the financial markets carries a significant risk of loss. Each material, shown on this website, is provided for educational purposes only. A perfect, 100% accurate method of analysis does not exist. If you make a decision to trade or invest, based on the information from this website, you will be doing it at your own risk. Under no circumstances is Trendsharks responsible for any capital losses or damages you might suffer, while using the company’s products and services. For more information read our Terms & Conditions and Risk Disclaimer.


