The overbought GBPUSD is set to finally catch up with the growing inflation bubble that has started to tighten its grip on financial markets as of late. Consumer prices are rising globally, driven by soaring commodity prices, which is causing investors to be worried about the prospects of the global economy getting overheated.
Britain is next in line to report its latest CPI findings, and the preliminary forecasts anticipate headline inflation to have doubled over the last month. Such data is likely to weigh down on the pound, which has benefited so far from the faster-than-expected pace of recovery.
However, the underlying fundamentals that have contributed to the strengthening of the pound, and thereby the cable, are currently changing. With the prospects of growing uncertainty, traders and investors are once again likely to turn their attention to lower-risk securities. In turn, this is likely to support the reeling dollar.
That is why the GBPUSD is likely to continue developing its bearish reversal, which has already been observed in the previous analyses of the pair.
The Double Top in the Making
The underlying technical indicators are also underpinning the increasingly more bearish-looking market sentiment. Primarily, the consolidation of the price action near the psychologically significant price level at 1.40000. Chiefly, the emergence of a Double Top pattern just above this major resistance-turned-support.
Double tops are commonly taken to signify likely bearish reversals, which is inlined with the expectations for the development of a new downtrend. Once the current Right Top is thus concluded, the price would be ready to attempt sinking below 1.40000 once again. Afterwards, depending on the strength of the underlying bearish commitment, the new downtrend is likely to probe the 23.6 per cent Fibonacci retracement level at 1.38728.
Notice that the psychological support is about to converge with the 20-day MA (in red), whereas the 23.6 per cent Fibonacci retracement is currently doing the same with the 50-day MA (in green). Also, the 100-day MA (in blue) is drawing near. All three moving averages serve as floating supports, which could potentially stave off the bearish correction at any moment.
Even still, if the bearish commitment in the market is enough to drive the GBPUSD below all three and the 23.6 per cent Fibonacci, then the downtrend would be ready to attempt heading towards the next psychologically significant target - the 38.2 per cent Fibonacci retracement level at 1.36436.
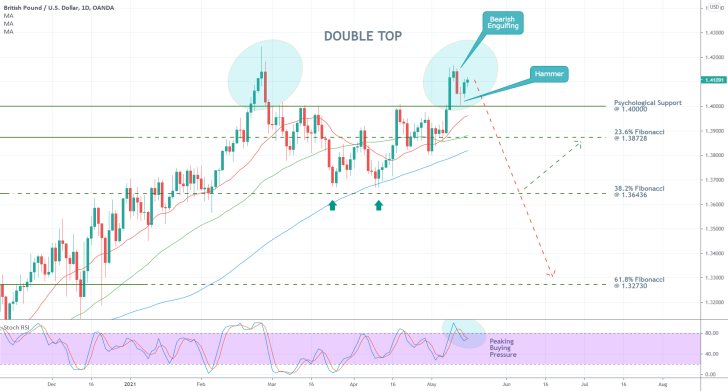
The massively overbought Stochastic RSI indicator implies that the buying pressure may have already peaked, which would favour the beginning of a new dropdown. However, this may yet take some time to unfold. Notice that following the establishment of a bearish engulfing candle at the Right Top, the price dropped close to 1.40000.
This minor dropdown was followed by a minor pullback, leaving in its wake a Hammer candlestick. This behaviour of the price action means that the underlying bullish commitment is not yet entirely exhausted. The GBPUSD may continue fluctuating in range in the near future before a decisive dropdown occurs.
Threading the Resistance
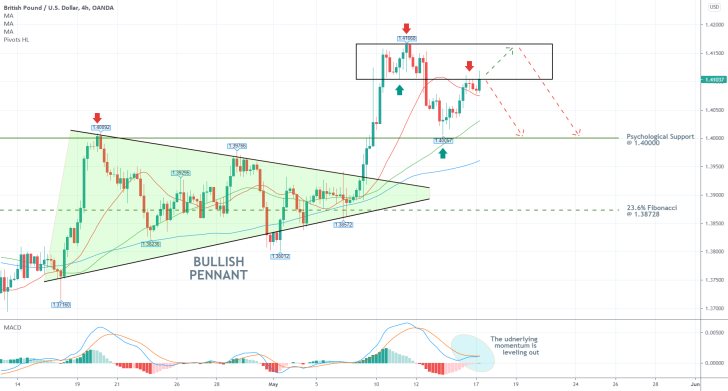
The last breakout above 1.40000 was the result of the completion of a major Bullish Pennant as a trend-continuation structure. It peaked at 1.41668, which commenced the establishment of a new consolidation range (the rectangle).
Following the beginning of the last bullish pullback from the 1.40057 pivot low (the Hammer candle on the daily chart above), the price action reached the rectangle once more, this time from below. At present, the price action is contained above the 20-day MA and below this consolidation rectangle. The latter is serving as a resistance area.
Given that the underlying momentum is currently levelling out, as illustrated by the MACD indicator, the price action may behave in one of two ways in the near future. It could either reverse from the lower boundary of the rectangle immediately or do so from its upper boundary.
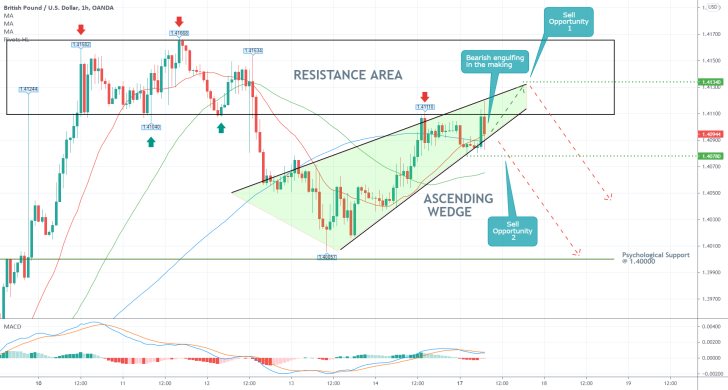
As can be seen on the hourly chart below, the GBPUSD is probing the lower end of the rectangle while developing a minor Ascending Wedge. In the context of the overall market picture, the emergence of such a Wedge at the present moment can be taken as a piece of evidence that, indeed, the bullish pressure is running on fumes.
Market bears can use this information to decide when and where would be appropriate to enter short by utilising contrarian trading strategies. They should watch the behaviour of the price action around the boundaries of the Wedge to interpret when the market would be ready to start falling.
In other words, they should watch for a decisive breakdown below the lower end of the Wedge as a likely indication of the beginning of the new dropdown.
Concluding Remarks:
More risk-averse traders can wait and see whether the price action would penetrate within the consolidation rectangle. If so, they could look for an opportunity to sell around 1.41340. Conversely, they could also use the second such signal, which would be encapsulated by a breakdown below 1.40780.
In either case, they should use tight risk management techniques. That is so because contrarian trading involves a high degree of risk of erratic fluctuations around tops/bottoms. That is why it would be a good thing to place stop-loss orders that are no more than 30 pips away from the initial entry-level.
Additionally, it should be remembered that contrarian trading usually necessitates multiple attempts for getting a good entry. That is why bears may have to place several orders before the market starts going south.
GBPUSD Set to Complete an Ascending Wedge
The release of the U.S. GDP numbers and new orders data later this week, is bound to cause some extra volatility on all currency pairs involving the dollar. Meanwhile, the apparent lack of any major events in the UK would likely leave the pound comparatively more subdued. This is the type of environment that would benefit GBPUSD bears.
The expectations for the establishment of another bullish upswing on the price of the Nasdaq composite in the short term would make it even likelier for the reeling greenback to make up for its recent losses in the near future. That is so because the dollar tends to be affected positively by gaining stocks.
Hence, the purpose of this follow-up is to examine the possibility of the emergence of a bearish correction on the cable in the near future.
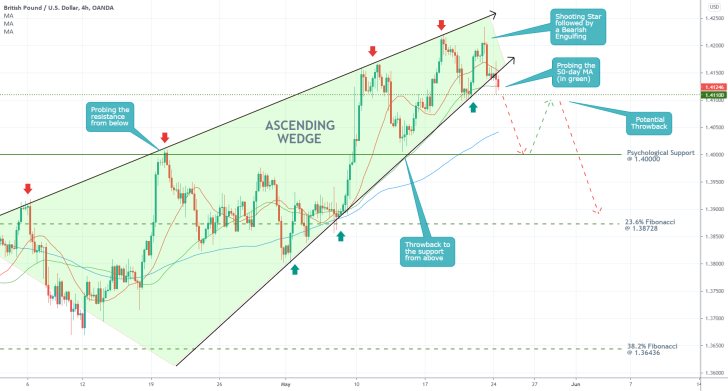
As can be seen on the 4H chart above, the latest upswing on the GBPUSD takes the form of an ascending wedge. This in itself substantiates the bearish anticipations. The price is currently probing below the lower boundary of the Wedge, which represents the most significant piece of bearish evidence.
Even more significantly, this bearish test comes shortly after the price action established a Shooting Star candle followed by a Bearish Engulfing - both representing growing selling bias in the short term.
After having broken down below the 20-day MA (in red), the price of the GBPUSD is currently probing another floating support - the 50-day MA (in green). If the price action manages to shoot below the latter and the minor support level at 1.41100, then it would be free to head towards the psychologically significant support at 1.40000; potentially even the 23.6 per cent Fibonacci retracement level at 1.38728.
However, an interim rebound from 1.40000 is quite possible given how the level has already changed its roles in the past (from resistance to support). Market bears should not rush to sell necessarily at the current level. They could practice more caution by waiting for a definite breakdown below 1.41100.
GBPUSD Against History
More and more indicators on the GBPUSD are turning prevailingly bearish, which could be interpreted as an indication of an upcoming reversal. As regards the underlying fundamental factors currently in play, the upcoming U.S. industry and employment data later this week are likely to strengthen the greenback.
These numbers are scheduled for publication just as the U.S. dollar began showing early signs of stabilising, which is why a reversal seems even more probable in the near future.
Meanwhile, the GBPUSD has come very close to a resistance level with historic importance. The 1.42420 barrier was last broken in June 2016, which attests to its role as a prominent turning point. The price action had reached that level on two separate occasions since then (in April 2018 and February 2021), but it has failed to penetrate above it both times.
That is why an imminent reversal from said resistance seems highly likely in the very near future.
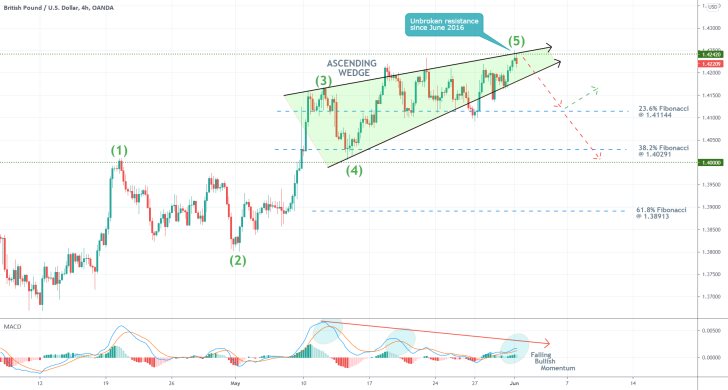
There seems to be a confluence of bearish signals as well. For one, the MACD indicator is underpinning a divergence in the making (diminishing bullish momentum) just below the 1.42420 resistance.
This is happening just as the price action is about to complete a major 1-5 impulse wave pattern, as postulated by the Elliott Wave Theory. When such patterns are finalised, the market typically tends to establish a corrective movement in the opposite direction.
Moreover, the last two legs of the pattern - the retracement (3-4) and the subsequent impulse (4-5) - are taking the form of a major Ascending Wedge. This is a type of structure that also entails potential bearish reversals in the near future.
Bears could search for an opportunity to sell the underlying at the current market price, placing their stop-losses no more than 30 pips above the resistance, but they should look for one crucial confirmation of the bearish setup - a decisive breakdown below the lower boundary of the Wedge.
If such a breakdown does occur, then the price action would be clear to head towards the next critical targets. The 23.6 per cent Fibonacci retracement level at 1.41144 and the psychologically significant support at 1.40000. These Fibonacci retracements are drawn against the broader 1-5 impulse wave pattern.
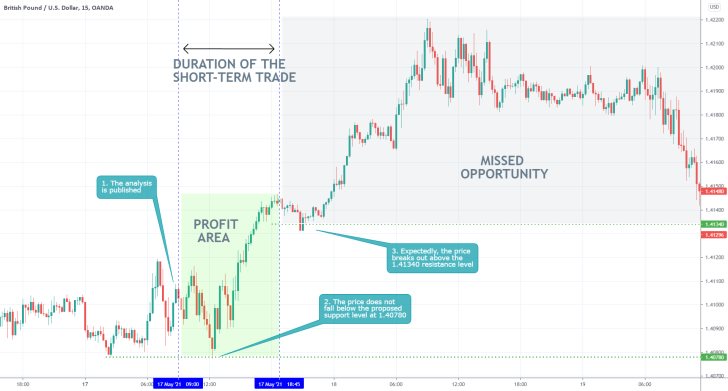
- The expectations of the analysis for an immediate price appreciation were realised as the GBPUSD rose from the 1.40780 support to the 1.41340. Despite the accumulated profits, however, the trade failed to catch the continued upswing above that.
- Traders should always strive to squeeze the maximum out of any possibility. Otherwise, they limit their winners, making the weight of the losers more prevalent.
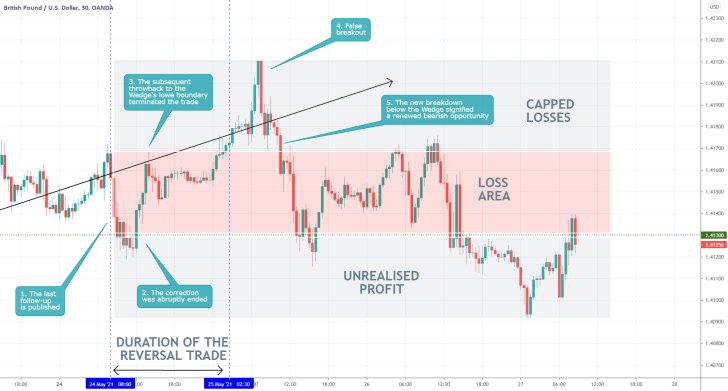
- This is one of those times when the underlying idea was good, but it ultimately came to no avail. That is why we emphasise each time that using trend reversal trading strategies entails a high degree of risk.
- The reversal trade was opened shortly after the price of the GBPUSD had broken down below the lower boundary of the major Wedge pattern. However, it was the snap rebound that led to its termination.
- Overall, the pair continues to fluctuate erratically in range, which means that the underlying market environment continues to be unfavourable for implementing most types of trading strategies.
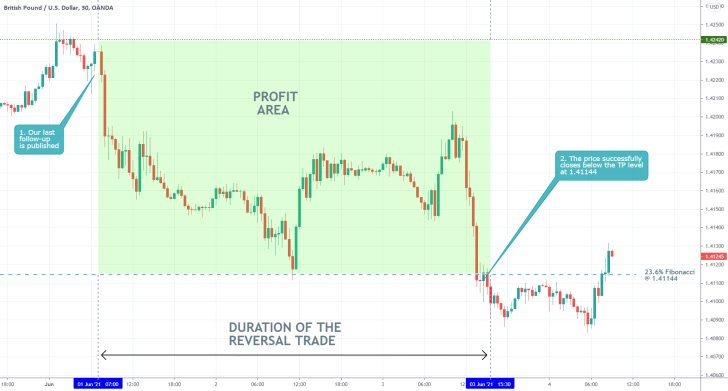
- The last follow-up analysis of the GBPUSD elucidated a perfectly timed reversal trade, just as the price action reversed from the major resistance level at 1.42420.
- The follow-up successfully projected a dropdown to the 23.6 per cent Fibonacci retracement level, which represents the first step in the development of a probable new downtrend.
- Bears and bulls should watch the U.S. non-farm payrolls, scheduled for publication later today, as the data could send the price action in either direction.
Disclaimer: Your capital is at risk! Trading and investing on the financial markets carries a significant risk of loss. Each material, shown on this website, is provided for educational purposes only. A perfect, 100% accurate method of analysis does not exist. If you make a decision to trade or invest, based on the information from this website, you will be doing it at your own risk. Under no circumstances is Trendsharks responsible for any capital losses or damages you might suffer, while using the company’s products and services. For more information read our Terms & Conditions and Risk Disclaimer.


