All of you movie buffs out there probably immediately understood the reference in the title to the movie "There will be blood". Without getting into too much film trivia here, the story revolves around the early days of the crude oil industry, and today's analysis focuses on the latest developments concerning the price of crude oil futures.
The price of the commodity enjoyed a remarkable rally recently, as fears over muted global demand were promptly replaced by heightened investors' enthusiasm following the latest vaccine news and developments at Washington. The market is riding high on its expectations for the future, which is distorting the general demand for safe-haven assets in favour of oil and the greenback.
For as long as demand for crude remains so high, the risk for a new supply glut remains comparatively low. The current bullish sentiment is undeniably strong, and the price of oil is expected to continue climbing in the following weeks, which is substantiated by most underlying fundamentals.
Therefore, traders who would like to capitalise on this market setup would have to look for the next opportunity to join the existing trend, preferably following a bearish correction. That is why the purpose of today's analysis is to examine the best possible scenario for the implementation of such trend-continuation trading strategies.
1. Long-Term Outlook:
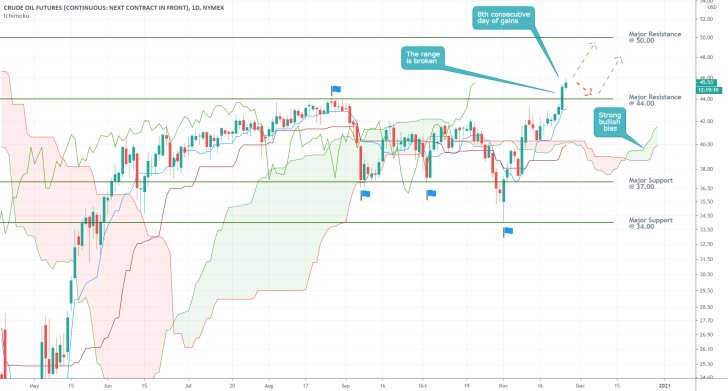
First of all, the transition of the market from the previous range-trading environment into a new bullish-trending one has to be confirmed. As can be seen on the daily chart below, the price action had been range-trading between the major resistance level at 44.00 and the major support level at 37.00 since mid-June – the flags highlight the more prominent rebounds from one of the two extremes of the range. Yesterday's major breakout above 44.00 represents the first substantial attempt at the formation of a new bullish trend.
The Ichimoku Cloud indicator is applied to evaluate the changing market bias. Yesterday's breakout above the range's upper boundary prompted the emergence of renewed bullish bias (this is ascertained from the changing cloud). Hence, the indicator confirms the primary expectations for continued price appreciation in the near term. However, several factors warrant closer consideration here.
Throwbacks to the resistance typically follow such major breakouts, the first of their kind, from a substantial and long-lasting range. These throwbacks (retracements) test the price level's new role as a support. In this particular case, traders should prepare for a potential retracement to 44.00 in the very near future, before the currently developing uptrend can be continued.
Notice also that the price action has been climbing steadily for the last seven days – each subsequent candle has closed higher than its opening price. Yesterday's candle, being seventh in line, represents a crucial benchmark – traders would increasingly recognise the need for a bearish correction. Hence, there are even more reasons justifying the expectations for a temporary pullback, which would allow traders to join the market at the resulting dip.
The main goal for the evolving bullish trend is the major resistance at 50.00. It bears significant psychological importance, so traders should be especially mindful of the behaviour of the price action close to this psychological barrier.
2. Short-Term Outlook:
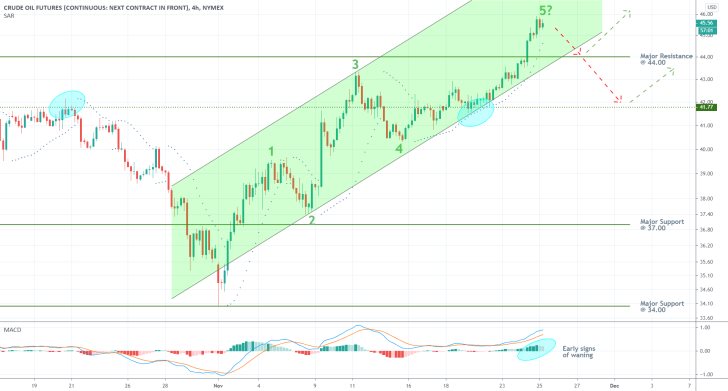
As can be seen on the 4H chart below, the evolving 1-5 impulse wave pattern, which played a crucial role in the last follow-up, continues to represent a significant indicator of the latest price sentiment. Given that the price action is currently in the process of establishing the final impulse leg (4-5), a subsequent bearish correction seems highly plausible, which is also inlined with the aforementioned projections.
Such a correction is likely to form a dip around the major resistance (currently becoming a support) level at 44.00, as was argued earlier. Hence, market bulls should be looking for opportunities to join the market after a rebound from 44.00. However, if the short-term bearish commitment proves to be stronger than anticipated, the price could slide as low as the minor support level at 41.77 before the bulls regain control. This scenario should be considered carefully, especially by more risk-averse traders.
At present, the underlying momentum remains ostensibly bullish, as demonstrated by the MACD indicator. Nevertheless, the histogram is already showing early signs of exhaustion, which could be a precursor to the expected bearish correction.
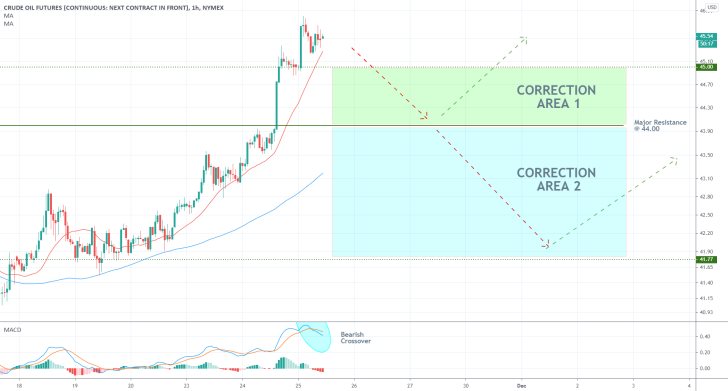
The MACD has already formed a bearish crossover on the hourly chart below, which represents an even more substantial piece of evidence that bearish momentum is rising in the very short-term.
The expectations for the development of a temporary bearish correction towards 44.00 are going to be further substantiated if the price action breaks down below the 20-day MA (in red). The latter is serving the role of floating support, similarly to the 100-day MA (in blue).
As regards the possibilities for trading on the current setup, traders need to approach them with caution, despite the pronounced bullish sentiment. What this implies is that traders who do not have open positions at present should refrain from joining the market right away - even if the price action resumes climbing without an intermediate correction. As was mentioned earlier, the uptrend has already passed the seventh-day mark of consecutive gains, so imprecise entry would expose the trader to an eventual dropdown.
3. Concluding Remarks:
Traders should look for opportunities to use trend-continuation strategies once the price action drops to one of the two closest support levels; or at any rate, look for the next clearly distinguishable dip. These potential scenarios are represented by the two Correction Areas on the chart above. As was mentioned earlier, the psychological resistance at 50.00 remains the primary target for the nascent uptrend. Remember also to use narrow stop-loss orders close to the entry at the dip.
Crude's Mixed Sentiment
Crude oil is currently trading in a tight range – the short-term outlook- despite the upsurge in buying pressure that has been observed since late-November. The market bulls were driven by heightened vaccine optimism, whereas the latest consolidation is attributed to increased selling pressure. The overall market sentiment is now much less tilted to either side, which means that the commodity is likely to continue range-trading in the near future.
The momentary stabilisation of crude futures' price around 46.00 dollars per barrel is resulting from the attempts of OPEC and OPEC+ to recalibrate the underlying supply and demand equilibrium. This endeavour has been hugely successful due to the agreement that was struck amongst the organisations' members. In essence, the energy market is now in a much better position to deal with sudden crashes in aggregate demand owing to the coronavirus pandemic compared to early-March.
While the vaccine optimism, which fuels the hopes for recovering the global economic output to the pre-crash levels by the end of 2021, continues to be a significant factor for the strengthening of crude oil, it is unlikely to drive the price any higher at the present rate. The overall trading activity typically falls towards the end of December and the Festive period, due to the impact of market seasonality, which leads to greatly diminished levels of underlying liquidity.
With such low-levels of liquidity, most assets stop trending due to lack of general market commitment. Instead, somewhat erratic range-trading becomes much more prevalent in the last two weeks of December. That is why the price of crude oil futures is likely to continue ranging in the near future.
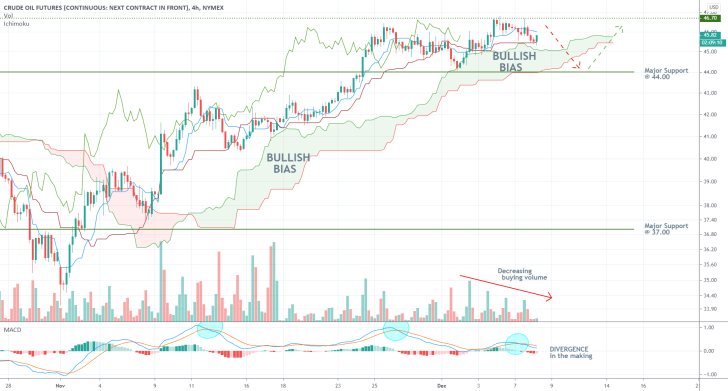
As can be seen on the 4H chart above, the price action is currently contained within a consolidation range spanning between the resistance at 46.70, and the major support level at 44.00. The overall market sentiment remains mostly neutral, though slightly tilted in favour of the bulls.
This can be inferred from the Ichimoku cloud indicator. Given that the cloud maintains its ostensibly bullish bias, the price action is likely to test the 46.70 resistance yet again. However, the cloud is also tightening, which implies falling bullish bias.
Notice also that the underlying trading volume (buying) has been depreciating ever since the price action established the previous swing high. That is why the price action failed to advance any further beyond the 46.60 swing peak, which is illustrative of the increasingly more pronounced range-trading environment.
Moreover, the MACD indicator is demonstrating the currently falling bullish momentum (a Divergence in the making), which confirms the expectations for the emergence of a new range-trading environment.
When all of these factors are considered together, it seems that the market is preparing to fluctuate between the lower band of the Ichimoku cloud, which is currently converging with the major support level at 44.00, and the 46.70 resistance. If these expectations are confirmed within the next following days, this will create the perfect environment for utilising range-trading strategies. Namely, the bulls would be looking for an opportunity to enter long around the bottom of the range, provided that the price action does not establish a significant breakdown below 44.00.
Crude Oil's Rally Continues Uninterrupted
Crude oil's futures contract is advancing steadily towards its next psychologically significant target level, which creates favourable opportunities for traders to use trend-continuation strategies.
The energy market benefited from diminished adverse volatility over the last several days following the recent OPEC meeting. This negated the negative impact of the general 'market noise' on the underlying price action of crude oil. In other words, the behaviour of the commodity's price action is much less erratic at present. This allows for the underlying directional trading to continue with its uninterrupted development.
The primary focus of most market participants this week is going to be centred on the monetary policy decisions of some of the most significant central banks in the world. The gathering of the FOMC, which is scheduled to take place tomorrow, is expected to garner the most public interest this week.
All of this implies that crude's price action is unlikely to experience massive tribulations over the next several days, which, in turn, would allow traders to take advantage of the evolving trend.
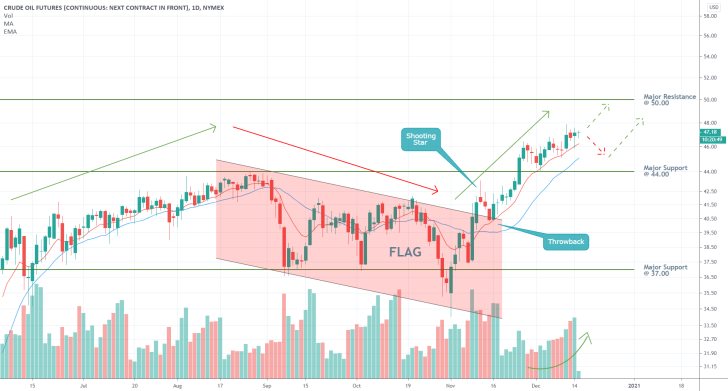
As can be seen on the daily chart above, the broader uptrend constitutes three integral stages. The initial upswing that reached the major resistance level at 44.00; the subsequent retracement, which takes the form of a Flag pattern; and the currently developing a resulting upswing. The latter is expected to target the psychologically significant retracement level at 50.00, which could serve as a potential turning point; however, it is also possible for the price action to establish a minor bearish correction first.
Notice that there has been a resurgence in the underlying trading volume that has been transacted over the last several days, which favours the continuation of the rally. Nevertheless, there has been only one major retracement to the major support level at 44.00 after the price action broke out above it, which underlines the likelihood for the development of a new correction in the near future.
For the time being, the price action remains concentrated above the 20-day EMA (in red) and the 20-day MA (in blue), which demonstrates the strong bullish bias in the short run. However, a potential correction could test breaking down below the latter, which is what the market bulls need to consider carefully.
Overall, market bulls who have running positions could keep them open, potentially moving their stop-loss orders higher. Meanwhile, traders seeking to join the existing trend should wait for the establishment of a correction, as buying in near the current swing high would entail massive risk.
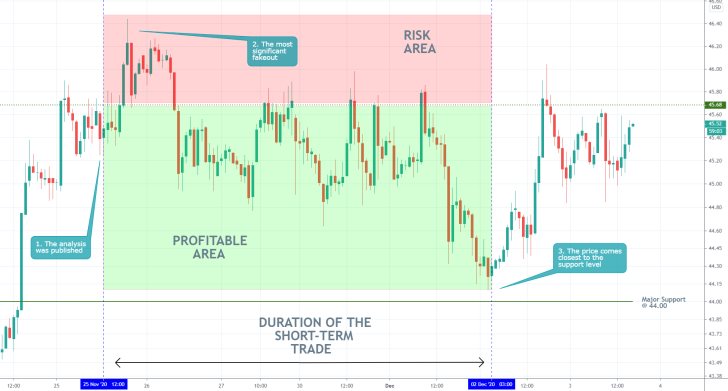
- So far, the market has been behaving almost exactly as per the forecasts of the analysis – the price action consolidated in a tight range between the support at 44.00 and the resistance at 45.68. The erratic (momentary) fluctuations above the latter represent the biggest outtake from the above setup, in that they underpin the unpredictability (high volatility) as the underlying market sentiment is changing.
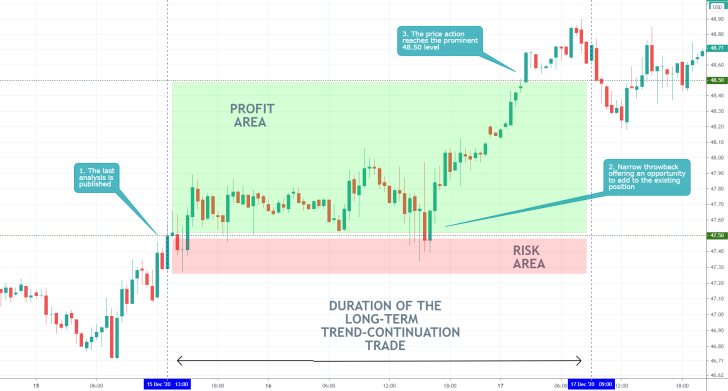
- Perfectly executed trend-continuation trade. Not much to say here except that more could have been done in terms of adding up to the position. Traders who have open positions in the general direction of the trend should not be afraid to take maximum advantage of it.
- The trade should better be terminated around the current market price given the anticipated drop in underlying market liquidity around the Christmas holidays.
Disclaimer: Your capital is at risk! Trading and investing on the financial markets carries a significant risk of loss. Each material, shown on this website, is provided for educational purposes only. A perfect, 100% accurate method of analysis does not exist. If you make a decision to trade or invest, based on the information from this website, you will be doing it at your own risk. Under no circumstances is Trendsharks responsible for any capital losses or damages you might suffer, while using the company’s products and services. For more information read our Terms & Conditions and Risk Disclaimer.


