The EURGBP seesawed during the most turbulent times of the coronavirus crash in March, but the pair's price action has stabilised since then. Recently, it established a new peak in the underlying bullish trend's progression, which could be the final step of its development. A bearish trend reversal has been anticipated ever since we examined the EURGBP in our previous analysis, and at present, this assertion seems even likelier.
As it is about to be seen in today's analysis, the pair is currently confined within the boundaries of two psychologically important Fibonacci retracement levels. Moreover, the behaviour of the underlying price action is signalling the likely preparation of the EURGBP to reverse its direction. Consequently, one of the purposes of today's analysis is to examine this technical setup and to delineate on the underlying opportunities for contrarian trading.
The demand for the euro is currently subsiding due to the ongoing recovery process and the fact that investors are no longer seeking only low-risk securities. While many central banks acknowledge the fact that uncertainty related to the pandemic continues to pose a significant threat to the global capital markets and economy, it is not as severe as the uncertainty that was observed in late-March. Hence, there is lesser investors' interest in hedging the associated risks from this uncertainty, which drives the demand for the euro down.
Due to these fundamental developments, the reeling pound, which continues to suffer from the tribulations associated with the protracted Brexit negotiations, now has a chance to regain some ground that was previously lost to the euro.
1. Long-Term Outlook:
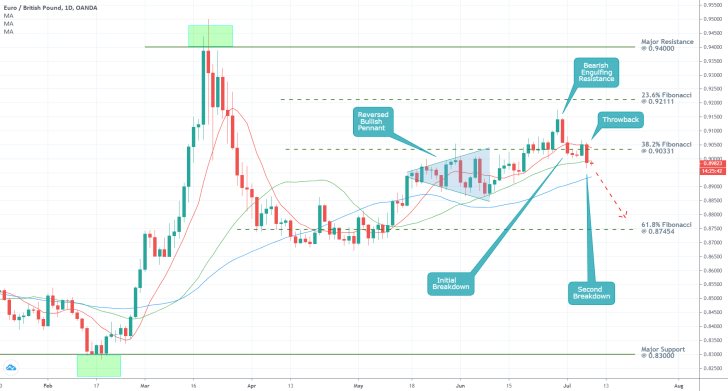
As can be seen on the daily chart below, the EURGBP failed to remain trading above the psychologically important resistance at the 38.2 per cent Fibonacci retracement level at 0.90331. On Monday, the underlying price action broke down below that level, which was temporarily serving the role of a support. This is the main piece of evidence in support of the central assertion – the expectation for the development of a new dropdown.
The first selling signal came the previous Monday when the price action developed a bearish engulfing pattern just below the 23.6 per cent Fibonacci retracement level at 0.92111. Such sudden changes in the underlying direction of the price action around prominent levels of support and resistance typically indicate the changing market sentiment. The observed behaviour of the price action substantiates the initial expectations for the formation of a new dropdown.

The next day the EURGBP broke down below the 38.2 per cent Fibonacci, and also below the 10-day MA (in red) – 'the initial breakdown'. Afterwards, the pair consolidated just below the resistance for several days before it attempted to break out above it once again. This is encompassed by the 'Throwback' on the chart above. Notice that the throwback was adjourned once it reached the 10-day MA, which is now serving as a floating resistance.
Similar observations can be made in relation to yesterday's price action since the dropdown – the second breakdown - was temporarily staved off just above the 30-day MA (in green). Since the price action is currently trapped between the two moving averages, we are likely to see a temporary consolidation before the directional trading is resumed.
A break down below the 50-day MA (in blue) is going to be even more challenging for the price action. However, if it succeeds in penetrating this final support, there will be nothing left in the way for the formation of an even more substantial downtrend. If this were to happen then the next logical target level for the emerging bearish trend is going to be the 61.8 per cent Fibonacci retracement level at 0.87454.
2. Short-Term Outlook:
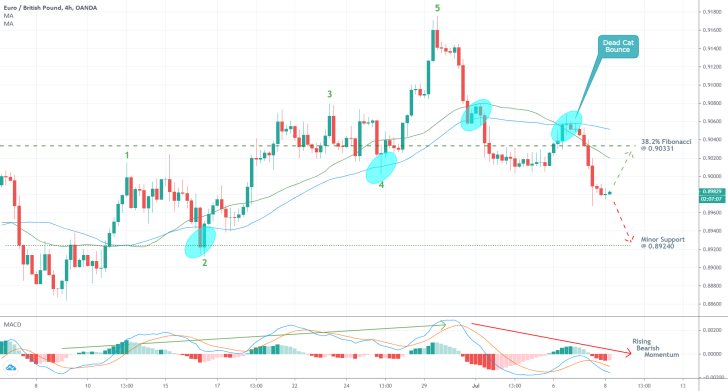
As can be seen on the 4H chart below, the recent bullish run is represented as a 1-5 impulse wave pattern, which is postulated by the Elliott Wave Theory. Naturally, after such a pattern is completed (in this case by reaching a peak at point 5), a reversal is to be expected.
Notice the first two times that the price action temporarily broke down below the 50-day MA. Both times the underlying direction of the price action was swiftly changed shortly after the breakdown, and the 1-5 wave pattern was subsequently allowed to continue advancing north. On the third occasion, the pair tested the strength of the 50-day MA. It consolidated briefly around the moving average, and then a breakdown was finally established.
The last time the price action tested the 50-day MA was to confirm its role as a floating resistance. This commonly found behaviour is signalling the prevalence of selling pressure in the market and the development of a new bearish trend. Moreover, this final confirmation of the moving average's significance comprises a 'Dead Cat Bounce' pattern, which is also typically found in bearish markets. In other words, there is a confluence of selling signals.
Seeing as how the underlying bearish momentum is also rising, which is confirmed by the MACD indicator, the next intermediate target for the price action is represented by the minor support level at 0.89240. The importance of the latter was solidified when the aforementioned 1-5 pattern reached a bottom there, at point 2.

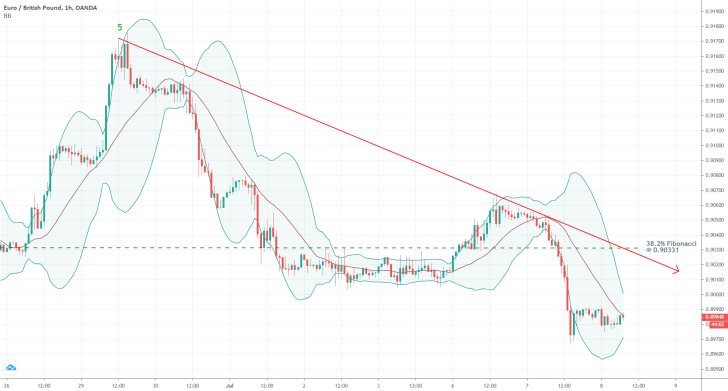
The hourly chart below manifests a newly developing trend line, which is downwards sloping. In relation to the aforementioned expectations concerning the likely consolidation of the price action in the short-term, we could anticipate retracements to set trend line before the price resumes falling.
The tightening Bollinger Bands further support these expectations regarding the immediate behaviour of the price action. While they remain contracted closely to each other, the price action is likely to stay horizontal, with minor fluctuations in a tight range. Once the gap between the bands resumes widening, however, directional trading is expected to ensue.

3. Concluding Remarks:
The EURGBP is currently reversing its direction and appears ready to head towards the 61.8 per cent Fibonacci retracement once again. Such a development could take days and even weeks to unfold, which creates favourable possibilities for swing trading and position trading along the way.
The market bears could start looking for advantageous entry levels; however, they should keep in mind that the pair could consolidate in the short-term. Adverse price fluctuations are also plausible, potentially reaching the 38.2 per cent Fibonacci retracement level before the bearish trend continues with its development.

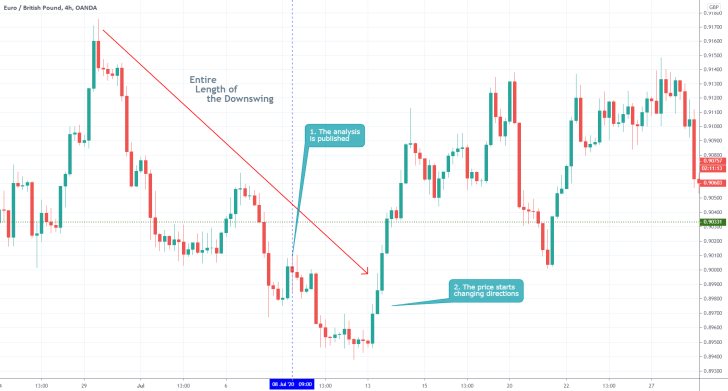
- The most significant drawback of the analysis was that it came in late, suggesting selling into an established downswing. This reduced the possibility for trading greatly. The analysis also misconstrued the propensity of the pair to continue tumbling in the longer-term.
Disclaimer: Your capital is at risk! Trading and investing on the financial markets carries a significant risk of loss. Each material, shown on this website, is provided for educational purposes only. A perfect, 100% accurate method of analysis does not exist. If you make a decision to trade or invest, based on the information from this website, you will be doing it at your own risk. Under no circumstances is Trendsharks responsible for any capital losses or damages you might suffer, while using the company’s products and services. For more information read our Terms & Conditions and Risk Disclaimer.


