The USDCHF has been trading up and down within the confinements of a tight range on the weekly chart, which makes the price action around key turning points quite calculable. Naturally, the pair is currently being affected by the ongoing tensions globally that are caused by the COVID-19 disease’s international spread. Even so, the technical factors still prevail over the fundamentals, which means that classic range-trading strategies can be applied to the current market setup with great efficacy.
The purpose of this analysis is to advance a detailed examination of USDCHF’s price action and its current behaviour in light of the ongoing coronavirus situation as it continues to develop and to underpin the likely turning points in its direction. Thereby, the ultimate goal of the analysis is to highlight how and when such range-trading strategies can be applied with the greatest expected returns.
1. Long Term Outlook:
The first major observation on the behaviour of the price action on the weekly chart below is connected to the major resistance level at 1.00100. It can be seen that the price has attempted to break out above it on four separate occasions, as represented by the four distinct waves that were becoming increasingly narrower prior to the eventual breakout that took place around April of 2019.
The price then traded around 1.02000 before it subsequently fell back below the resistance level at 1.00100. The fact that there was one more failed attempt at a breakout, that took place between October and November of 2019, further exacerbated the strength of the resistance level there and established the long term bearish sentiment. It, therefore, can be asserted that the bearish sentiment is likely to continue driving the price action lower towards the major support level at 0.95800.
In the medium term, it appears that the price action is contained within an even smaller range. Its upper boundary is the 38.2 per cent Fibonacci retracement level at 0.98476, and its lower boundary is at the 61.8 per cent Fibonacci retracement level at 0.96284. Additionally, the price is consolidating just above the middle line of a downwards sloping regression channel. All of this points to the likely continuation of the bearish price action in the long term, particularly if the price manages to break down below the middle line of the channel. In this case, the next target will be the 61.8 per cent Fibonacci retracement level.
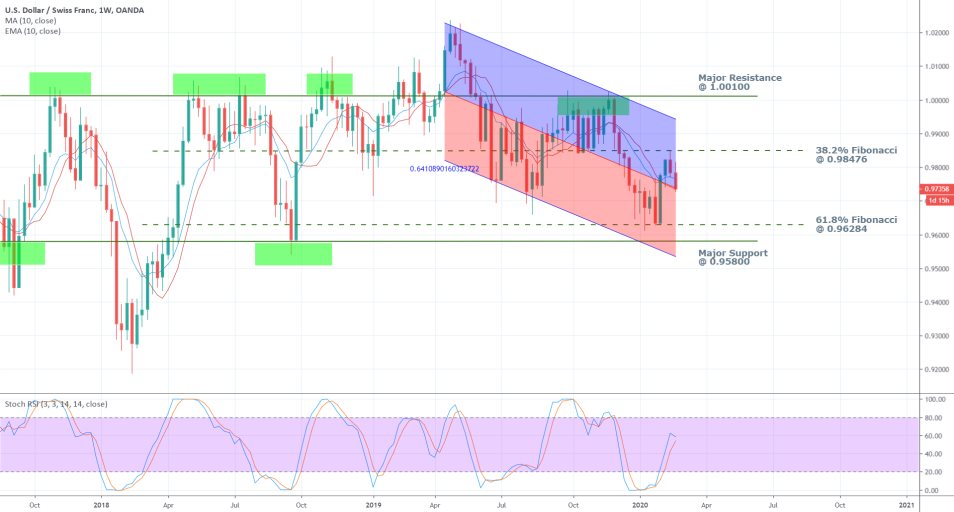
However, despite the predominately bearish long term sentiment in this range environment, in the midterm to short term, the situation is slightly different. The Stochastic RSI indicator demonstrates the accumulating long orders that are being transacted currently, ever since the price rebounded from the 61.8 per cent Fibonacci retracement and the support level there. This change in the underlying trading volume could prompt marginal bullish upswings in the short term.
The strengthening bullish momentum in the short term is exemplified by the relation of the 10-day Exponential Moving Average (EMA) to the 10-day Simple Moving Average (SMA). The former has recently crossed above the latter, which is illustrative of more pronounced bullish outlook in the market.
2. Fundamental Analysis:
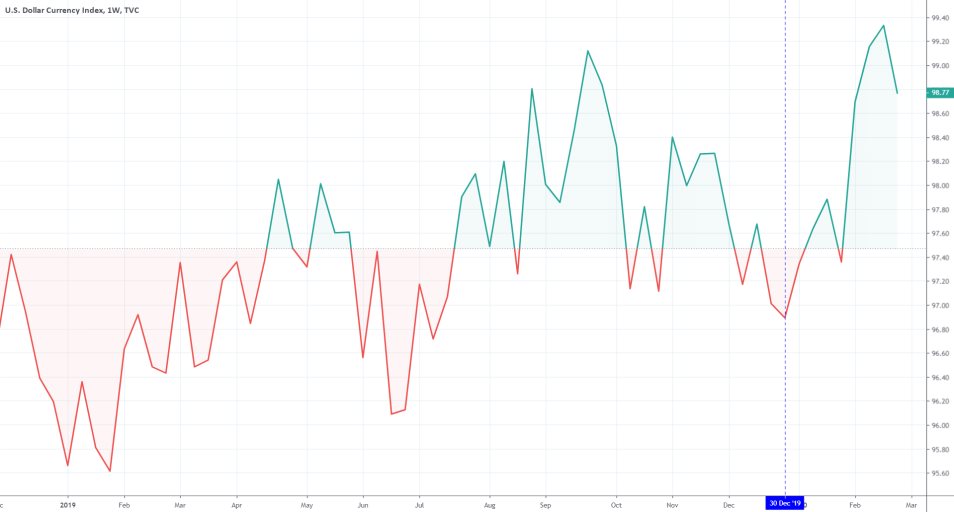
- In the US. The dollar started the new year more than promising, and since yearly January has almost incessantly continued to strengthen. The chart below represents strengthening on the dollar currency index, which represents the current performance of the greenback against a basket of other prominent currencies.
Two key events supported the bolstering of the dollar. Firstly, in early January the US and China signed Phase One of their trade negotiations agreement, under which the general uncertainty in the markets was diminished. That temporary alleviated the pain from the global capital markets, which allowed the greenback to head north on the renewed investors' optimism. However, the global economy started to become increasingly strained once more after the outbreak of the coronavirus was first announced in China.
Initially, the dollar exhibited resilience amidst the rising investors’ concerns, however, this week the currency started losing ground as the virus broke out in Europe and elsewhere, prompting reinvigorated fears of a new pandemic. The drop was caused by the admission of US authorities that the number of confirmed cases in the states is likely to increase in the following days, despite Donald Trump’s attempt to argue that the spread of the virus is contained.
The market is still pricing in the perceived threat from an outbreak in the US, and until it registers the news altogether, the dollar is likely to continue falling because of this new type of uncertainty.
- In Switzerland. The alpine country recently reported its first three cases and its close proximity to Italy, which currently has over 400 confirmed cases and is the most substantially impacted country in Europe, means that the threat of the coronavirus to Switzerland is comprehensible.
Nevertheless, government officials remain confident that the situation is being handled properly, and that there is no considerable risk of a mass epidemic to the general population. That is one of the reasons why the Swiss franc has remained relatively unscathed by the market tribulations that are currently weighing down on other financial assets that are considered not to be safe-havens.
When all of these factors are considered in conjunction with each other, it looks as though the USDCHF is likely to continue its depreciation further south. However, as soon as the initial shock from the news that the coronavirus is not contained outside of China subsides, the exerted pressure that is currently exerted on the dollar is likely to lessen as well. Thereby, the direction of USDCHF's price action is expected to change promptly by the end of the week.
3. Short Term Outlook:
The ADX on the daily chart below confirms the significance of the aforementioned range. The current value of the Average Directional Index is 16, and it has been threading below 25 index points since the 29th of January 2020. All of this alludes to the possibility for the application of range trading strategies, as the price becomes likely to bounce once it nears one of the range’s extremes. The RSI has recently entered into the ‘Oversold’ area, which is likely to prompt more market bulls to start opening more long orders.
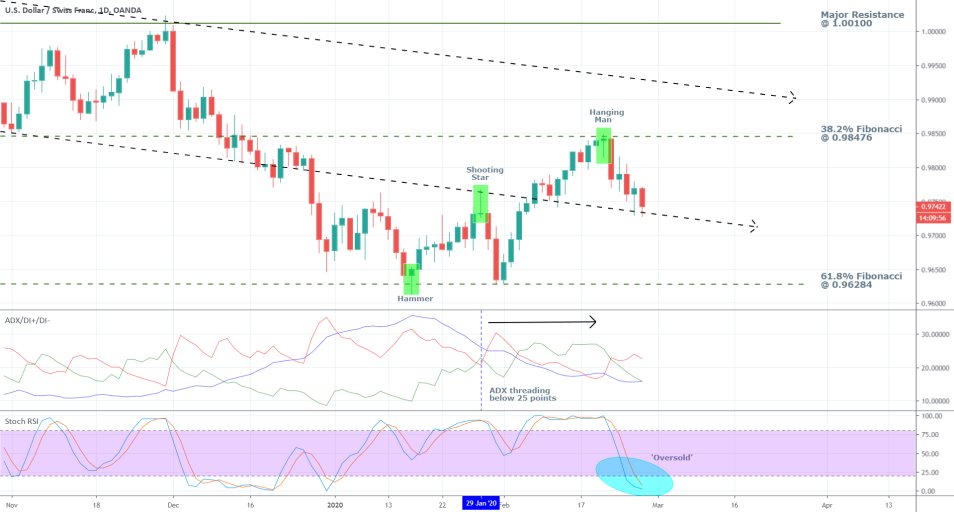
The price action evidently tends to behave in a predictable manner around crucial levels that are perceived as possible turning points. The hammer candlestick, for instance, which formed on the 61.8 per cent Fibonacci retracement level, was an early indication that the price was ready to jump from the support there. The shooting star is a candlestick that is commonly found at the top of a recent bullish trend or upswing. In this particular scenario, it evolved around the middle line of the regression channel, which in the context of the market signalled a possible bearish turning point. Finally, the handing man, which formed at the top of the next upswing and just below the 38.2 per cent Fibonacci retracement, was perceived as indicating the beginning of a new downswing.
It can be concluded that once the price action comes close to such an important level, regardless of whether it is a support or resistance, and such a prominent candlestick develops, that is probably an indication that the USDCHF is ready to change its underlying direction once again.
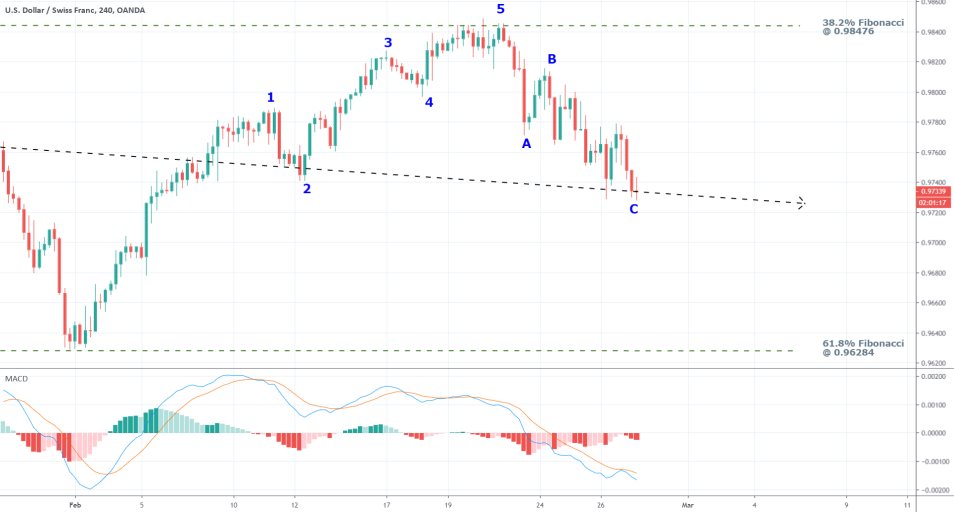
The 4H chart above demonstrates that in the short-term, the price action exhibits more distinctly directional behaviour. Elliott Wave Theory is applied to catalogue the likely turning points in the direction of the USDCHF's price, by underpinning the size and shapes of the comprising waves. Thereby, it can be established that the price action is close to terminating the current ABC correction, which means that a new directional movement is likely to develop. It can either go towards the support at 0.96284 or the resistance at 0.98476.
The MACD manifests the prevalence of the bearish momentum over the bulls. However, it also seems that the bearish momentum is nearing exhaustion, given the diminishing size of the bars on the stochastic.
If the price manages to break down below the regression channel’s middle line that would give further assurance to the bears, which means that a bullish rebound at the current level would be less likely to take place.
4. Concluding Remarks:
In the context of USDCHF’s current state, range trading strategies should be applied in conjunction with techniques for contrarian trading. This means that entries should be executed around crucial price levels, such as the five ones listed in this analysis.
Moreover, contrarian trades – opening long orders at new dips or short orders at new peaks – should be executed once the behaviour of the underlying price action is congruent with the readings of the applied indicators. Chiefly, one should look for the existence of distinct candlesticks such as the ones listed above around crucial price levels, which would make the change of the price’s direction seem more likely.
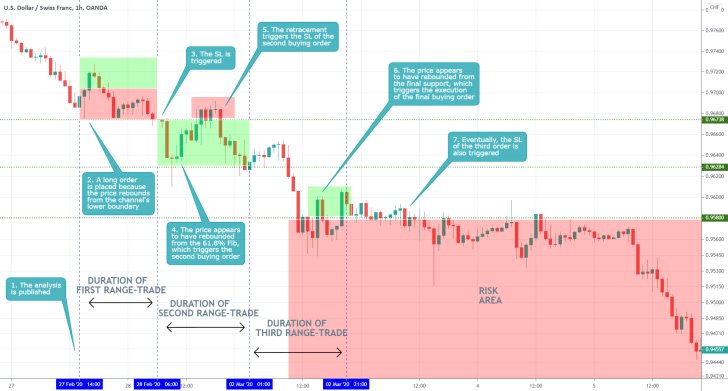
- Very poor performance all around. The analysis completely missed the point in regards to understanding the underlying market sentiment at that time. The expectation for the continuation of the range-trading environment inspired the execution of three inherently faulty positions (range-trading positions when the market was developing a downtrend). No trader is safe from misunderstanding the market sentiment at any given moment, it is inevitable to make mistakes. However, that is no excuse for not stopping yourself from repeatedly making the same mistake. Traders should not forget to constantly scrutinise their forecasts, and be on the lookout for pieces of evidence that proves them wrong.
Disclaimer: Your capital is at risk! Trading and investing on the financial markets carries a significant risk of loss. Each material, shown on this website, is provided for educational purposes only. A perfect, 100% accurate method of analysis does not exist. If you make a decision to trade or invest, based on the information from this website, you will be doing it at your own risk. Under no circumstances is Trendsharks responsible for any capital losses or damages you might suffer, while using the company’s products and services. For more information read our Terms & Conditions and Risk Disclaimer.


