The pair recently reached a new low during the establishment of the last bearish trend but has since then rebounded, which gives market bulls hope that the underlying market sentiment might be changing.
Considering the overwhelmingly positive retail sales data in the US from yesterday and the expectations for tentative inflationary numbers in Canada scheduled for release later today, the underlying fundamentals could indeed be starting to affect the USDCAD positively.
As it is about to be seen, the pair's price action is exhibiting distinctive characteristics commonly associated with trend reversal behaviour, which is what fuels the aforementioned anticipations regarding the emergence of a new bullish trend.
That is why the purpose of today's analysis is to examine set behaviour, to scrutinise the meaning behind the development of certain prominent types of candlesticks, and to outline the most significant levels of support and resistance that could play a pivotal role in the establishment of such an uptrend.
1. Long-Term Outlook:
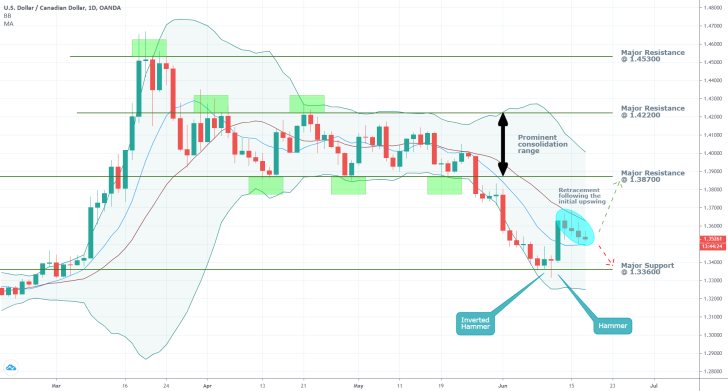
As can be seen on the daily chart below, the recent bearish trend was concluded when the price action bottomed out to the major support level at 1.33600. The same level roughly marks the area where the preceding bullish trend began its development, which further supports the notion. That is so because such prominent price levels frequently serve as beginning points for some trends, and later as termination points for others.
Notice the collection of two prominent types of candlesticks – an inverted hammer followed by a hammer - as the price action reached the major support level. This grouping represents the first significant indication pointing to a likely trend reversal in the works. The two types are typically found towards the lower ends of bearish downtrends and imply the expected transition of the market into a new bullish environment. The fact that these two candles formed at the major support level there only makes the main proposition seem even likelier.
The two candles were subsequently followed by a massive bullish Marubozu, which indicates a substantial increase in overall buying orders. Additionally, Marubozu candles, which have huge bodies and no shadows or tails, are commonly found at the beginning of new trends.
Afterwards, however, the price action retraced, which wiped out most of the gains that were made by the Marubozu. The retracement itself is presently contained within the Bollinger Bands' middle line (in red) and the 10-day MA (in blue). What this implies is that the retracement is not going to terminate the newly emerging uptrend. Instead, it represents a momentary pause before the price action resumes trading further north. It follows that the muted price action over the last few days creates an opportunity for bullish traders to join the market at the swing low.
It should, however, be mentioned that if the price action does fall to the major support level at 1.33600, the bullish trend's establishment could be postponed or concluded altogether. Conversely, if the broader anticipations are realised and the current retracement is followed by a new upswing, the first keystone target level would be the major resistance at 1.38700.

2. Short-Term Outlook:
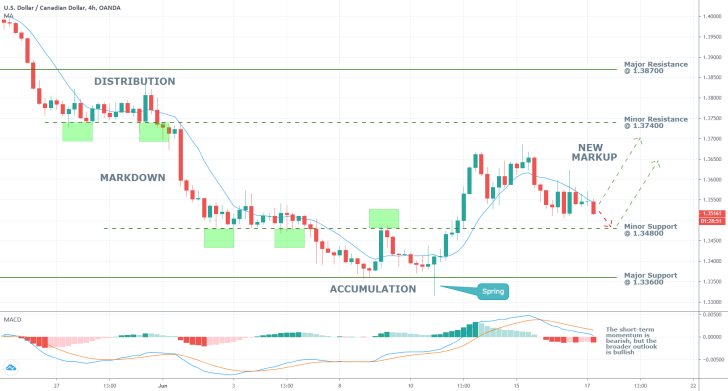
As can be seen from the MACD indicator on the 4H chart below, the short-term momentum is falling but remains in positive territory. This underlines the currently developing bearish retracement while signalling the likely continuation of the upswing's development afterwards. At any rate, the price action would have to break out above the 10-day MA and continue trading higher from there, in order for the renewed bullish commitment in the market to be fully confirmed. Before this happens, however, the price action could fall to the minor support level at 1.34800.
The latter served as an upper boundary for the last Accumulation range, which is where its prominence stems from. It is quite common for newly developing uptrends to retrace back to the preceding Accumulations before continuing to rise higher. Therefore, a rebound is projected to take place either at the current market price or once the price action falls to the minor support level at 1.34800.
It also follows that the first intermediate target level for the renewed bullish upswing is represented by the minor resistance level at 1.37400, which served as the lower boundary of the last Distribution range. Accordingly, the next potential correction (or small consolidation) that could be observed is likely to take place within the limits of set range. Such a correction, if it does emerge at all, is expected to be followed by a new upswing.

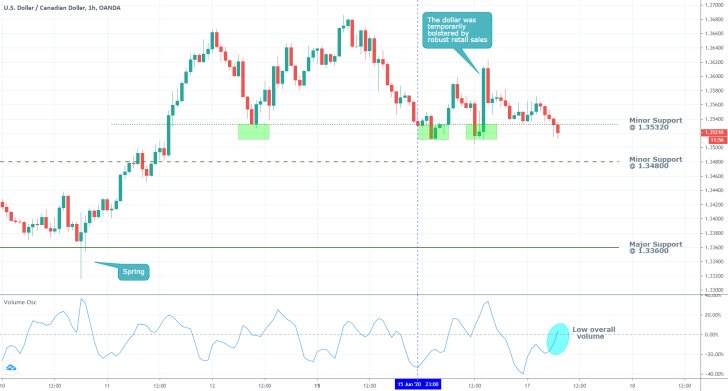
Another minor support level (at 1.35320) is presented on the hourly chart below, whose significance has already been proven on three separate occasions. It encompasses the third and highest price level at which the aforementioned retracement could be concluded, and the upswing resumed.
Notice the sharp upturn that was registered yesterday immediately following the US retail data's publication. Given the overall context, this behaviour encapsulates the previously mentioned shifting fundamentals and supports the broader expectations for the emergence of a new bullish trend. This is also substantiated by the fact that from 23:00 on the 15th of June onwards, the price action has started to consolidate. Such behaviour is not uncommon during the development of new trends and is also inlined with the previous assertions.
Finally, the aggregate volume is still relatively muted with no prevailing bias, which fosters the current retracement. However, once more buying orders are placed after the bulls determine that the market has already established a new swing low, this is likely to change. More pronounced buying pressure resulting from an increased underlying volume is going to prompt the advancement of the new bullish trend.

3. Concluding Remarks:
The USDCAD is in the very early stages in the development of a new bullish trend, which entails great prospects for early entry and therefore profitable trading. Nevertheless, the premature opening of long orders also bears significant risks due to the fact that heightened adverse volatility is typically especially prevalent during such transitionary stages of the market – from downtrends to uptrends and vice versa. Hence, traders should apply caution when choosing their entry levels. Multiple such possibilities exist at present.

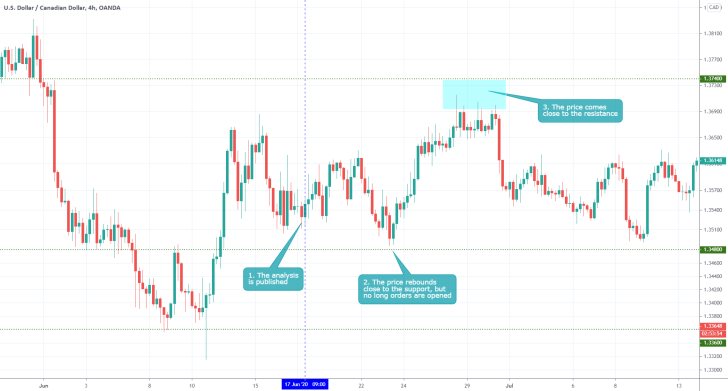
- The longer-term projections of the analysis were not realised. The price formed a new range instead of the anticipated markup. Once it was determined that the market was indeed range-trading appropriate indicators could have been implemented, such as the Stochastic RSI. Traders need to remember to use only indicators that are suitable for the underlying market sentiment.
Disclaimer: Your capital is at risk! Trading and investing on the financial markets carries a significant risk of loss. Each material, shown on this website, is provided for educational purposes only. A perfect, 100% accurate method of analysis does not exist. If you make a decision to trade or invest, based on the information from this website, you will be doing it at your own risk. Under no circumstances is Trendsharks responsible for any capital losses or damages you might suffer, while using the company’s products and services. For more information read our Terms & Conditions and Risk Disclaimer.


