The US dollar has been at the centre of traders and investors’ interest over the last few months as the global markets were rattled by the increasingly more volatile economic turmoil that is caused by the coronavirus pandemic. The greenback has once again taken the role of a global safe-haven asset, as individuals all over the world scrambled to hedge the risks they are facing from the ongoing market uncertainty. The dollar offers liquidity and is easily convertible, both traits that are sought after during times of general market panic.
Meanwhile, the Canadian dollar has been whipsawing for over a month now partially due to the same underlying fundamentals, but also due to the frequent U-turns in the oil price war’s progression – from its inception to the recent ‘seize fire’ between Russia and Saudi Arabia.
Now that the market has started to price in the long-term implications from a very likely deep recession that the world is almost certain to enter into at the very least during the first fiscal quarter, the underlying pressures that are exerted on the USDCAD are likely to undergo a new shift in dynamics.
Moreover, crucial economic data releases in the two countries today – retail sales in the US and BOC’s interest rate decision – are likely to bolster the underlying volatility on the USDCAD even more. That is why the purpose of today's analysis is to examine these long term and short term fundamentals' impact on the USDCAD and to highlight the current behaviour of the pair's price action.
1. Long Term Outlook:
As can be seen on the weekly chart below, the heightened demand for the greenback in early March – the time when the prospects of a new, global recession started to become more pronounced - caused the pair to break out above the major support level (previously resistance) at 1.35500. At the height of the global panic, the USDCAD even managed to briefly break out above the historic resistance at 1.45500 before it eventually reverted itself, leaving massive upper shadows indicating the prevailing uncertainty at that time.
The price action has subsequently fallen back to the critical 23.6 per cent Fibonacci retracement level at 1.38240, and it currently finds itself at pivotal crossroads. If the correction continues, the price might go as low as 1.35500 before it finds support. If, however, the underlying direction of the price action is changed once again, the USDCAD can even appreciate back to the historic resistance level at 1.45500.
Hence, the longer-term outlook of the pair remains relatively ambiguous, with few potential scenarios for future development currently in sight. While the price action remains confined within the boundaries of this broadly defined range – the historic resistance level at 1.45500 and the 23.6 per cent Fibonacci retracement level at 1.38240 – the USDCAD is likely to continue establishing the potential new distribution range outlined on the chart below.
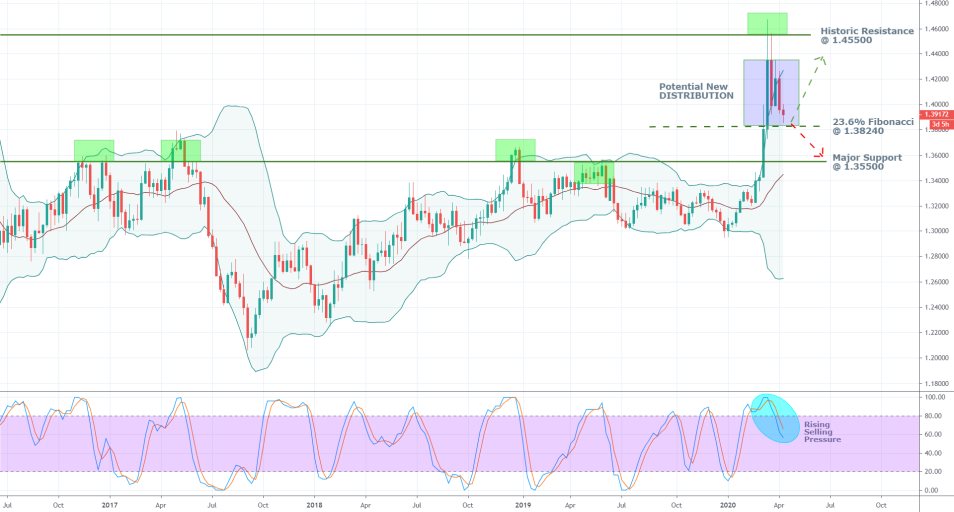
The exceptionally wide Bollinger Bands highlight the massive underlying uncertainty that is weighing down on the market at present, which is a favourable environment for the formation of erratic price fluctuations. Meanwhile, the Stochastic RSI has recently fallen below the ‘Overbought’ extreme, which is illustrative of rising selling pressure. As the RSI continues to head further south, the underlying dynamics in the market are also going to change, likely prompting more robust bearish pressure.
2. Canadian Interest Rate; US Retail Sales, and the Falling Demand for Crude Oil:
At the present moment, three crucial fundamentals are driving the price action on the USDCAD.
- Bank of Canada’s Interest Rate Decision. The Governing Council of the Central Bank has just announced that it has decided to keep the interest rate in the country unchanged at 0.25 per cent, which was expected by the market forecasts .
The BOC also announced that it would be ramping up its asset-purchasing program effective immediately, which would boost the overall liquidity in the country.
"Under its previously-announced program, the Bank will continue to purchase at least $5 billion in Government of Canada securities per week in the secondary market and will increase the level of purchases as required to maintain proper functioning of the government bond market. Also, the Bank is temporarily increasing the amount of Treasury Bills it acquires at auctions to up to 40 percent, effective immediately."
In the monetary policy statement, it was also acknowledged that:
“The Bank is also announcing today the development of a new Provincial Bond Purchase Program of up to $50 billion, to supplement its Provincial Money Market Purchase Program. Further, the Bank is announcing a new Corporate Bond Purchase Program, in which the Bank will acquire up to a total of $10 billion in investment grade corporate bonds in the secondary market. Both of these programs will be put in place in the coming weeks. Finally, the Bank is further enhancing its term repo facility to permit funding for up to 24 months.”
All of this means that the Central Bank has decided to loosen up its monetary policy in April, thereby adjusting it to be more accommodative as the global perils to growth from the economic fallout become more pronounced.
It is not entirely clear as to what would be the Loonie’s immediate reaction to the news due to the prevailing uncertainty in the market. However, the longer-term implications from the drastically increased liquidity would likely lessen the currency’s strength.
Meanwhile, the recent OPEC+ deal, which effectively ended the oil price war between Russia and Saudi Arabia, has provided only marginal pain relief for the struggling CAD.
That is so because the market is starting to consider the agreed-upon cuts in crude oil production as insufficient. The remaining glut in global supply continues to outweigh the falling demand worldwide as national lockdowns continue to exacerbate the energy market.
- Falling US Retail Sales. Due to the ongoing lockdown in the United States, the retail sales plunged by 8.7 per cent in March, which was the biggest monthly decline on record. The reported performance missed the market expectations, which were projecting a contraction of 8.0 per cent.
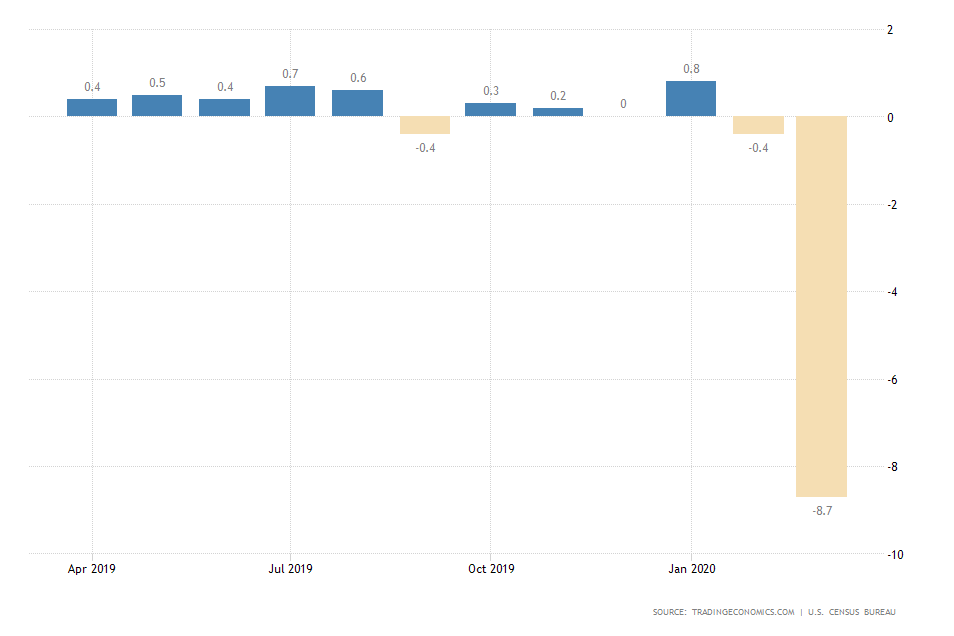
The major deterioration is likely to have a significant impact on the greenback in the immediate future as the market prices in the shock from the report's numbers. However, the longer-term impact on the currency is likely to be much less pronounced for a number of reasons.
Chiefly, the market as a whole is already getting more used to the transformational changes currently under the way due to the lockdown. The American economy is adjusting itself to be able to serve individuals who are social distancing themselves, which could, at the very least lessen contraction in retail sales in the future.
3. Short Term Outlook:
As can be seen on the daily chart below, the 20-day EMA (in red) has recently crossed below the 20-day MA (in blue), and the price action is currently threading below the two. This behaviour entails rising bearish momentum in the short term.
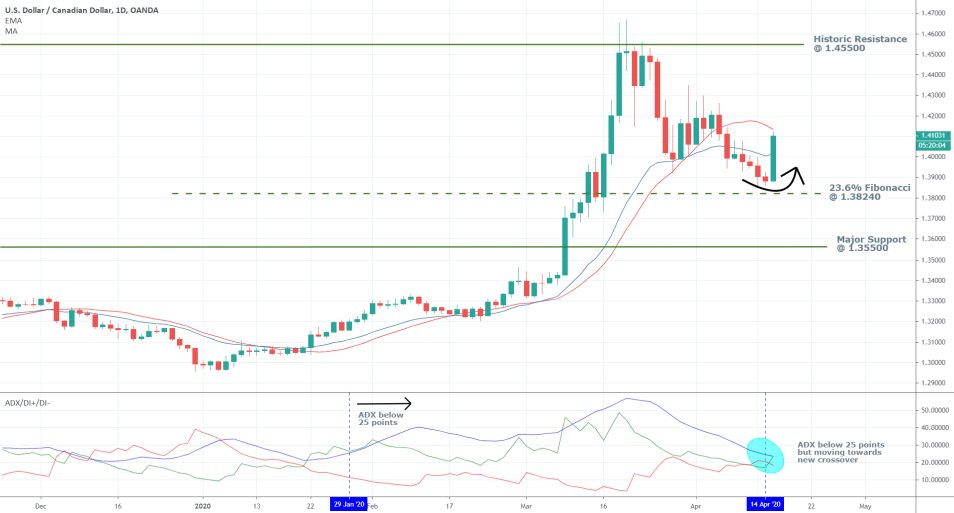
Nevertheless, the 23.6 per cent Fibonacci retracement level at 1.38240 and the support there appears quite robust, which might prove to be an obstacle for the increasingly more pronounced bearish momentum.
The recent bullish trend technically commenced on the 29th of January when the ADX crossed above the crucial 25 points mark. The index fell below 25 points yesterday for the first time since the most recent correction was initiated, which might actually favour the continuation of the bullish trend’s development in the longer term.
Despite this apparent contradiction, the market is currently entering into a technical range-trading environment, which might end up being the end of the correction. Once again, there is spare capacity in the market for the continuation of the bullish trend's development. This assertion is supported by today’s massive rally of the price action. The huge 1.60 per cent jump is owing to the aforementioned fundamental factors.
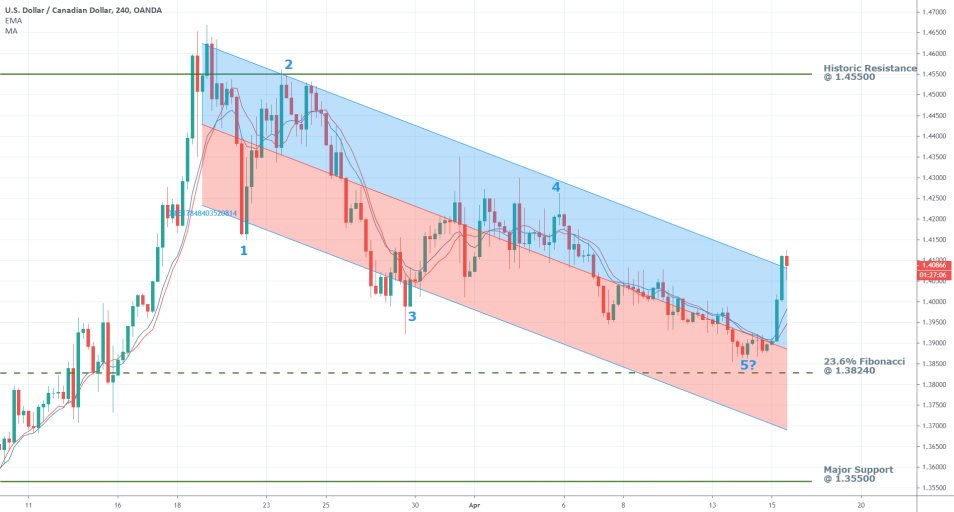
This rising bullish commitment is further supported by the behaviour of the price action on the 4H chart below. The entire correction represents a 1-5 impulse wave pattern, which appears to have been exhausted just above the 23.6 per cent Fibonacci retracement level. This behaviour is indicative of a changed underlying direction for the price action. Hence, the bullish spike that occurred over the last several hours is inlined with this assertion.
The USDCAD is currently attempting to break out above the regression channel's upper boundary. If the price action manages to overcome this obstacle, the bullish commitment in the short term would be confirmed, and the USDCAD is likely to continue rising afterwards.
4. Concluding Remarks:
Overall, the outlook on the USDCAD looks prevailingly bullish with strong support from the underlying fundamental factors and the behaviour of the price action in the short term.
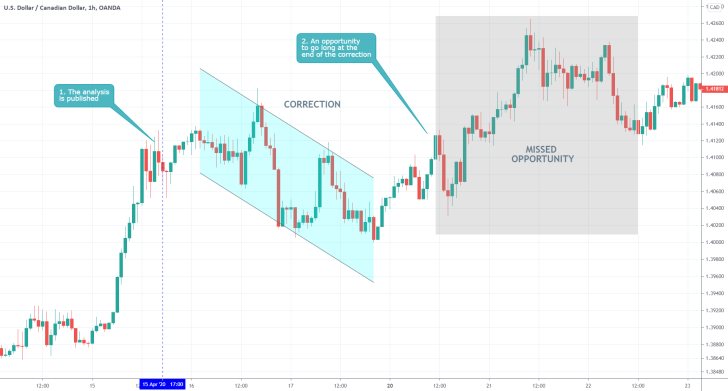
- The unprecedented nature of the coronavirus crisis caused many assets to behave erratically in the wake of the initial crash. That is why this analysis misread the underlying sentiment of the USDCAD pair in the middle of April. Instead of being ostensibly bullish-oriented, the pair was ranging for the better part of Q2. That is why, again, a failed reading of the underlying market sentiment was the main reason for not trading the setup.
- If the market sentiment had been understood better at that time, narrower levels of support and resistance would have been provided, which, in turn, could have been utilised with a greater efficiency. The big takeaway here is that more concise levels of support and resistance need to be drawn out at times when the market is ranging.
Disclaimer: Your capital is at risk! Trading and investing on the financial markets carries a significant risk of loss. Each material, shown on this website, is provided for educational purposes only. A perfect, 100% accurate method of analysis does not exist. If you make a decision to trade or invest, based on the information from this website, you will be doing it at your own risk. Under no circumstances is Trendsharks responsible for any capital losses or damages you might suffer, while using the company’s products and services. For more information read our Terms & Conditions and Risk Disclaimer.


