Arguably the most important conclusion that can be drawn from the recently finished earnings season in the States is that Big Tech and other companies in the technological sector have had an overall robust first quarter. Despite the ongoing coronavirus crisis, which has affected so many other industries, the tech sector remains not only relatively unscathed by the economic fallout, but it even manages to continue growing. This makes it the American economy's most likely tool to eventually spearhead the economic recovery.
Companies such as Apple, Microsoft, Facebook and Alphabet, the parent company of Google, have all mostly delivered better-than-expected quarterly earnings performances during the three months to March. This, in turn, has had an overall positive impact on the Nasdaq index, which is a composite of the technological sector.
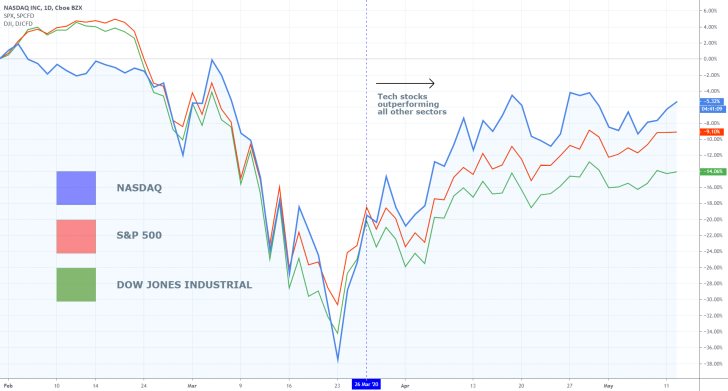
The Nasdaq has managed to rise by more than 15 per cent over the earnings season in April, which propelled the index into positive territory for 2020. In other words, it is currently trading higher compared to where the index started the year. The technological sector is thus the only segment of the economy to be so successful in light of the recent market turmoil, and the Nasdaq has managed to outperform both the S&P 500 and the Dow Jones Industrial Average.

That is why the purpose of today's analysis is to examine the current state of the Nasdaq, and to underscore the most likely future behaviour of its price action. Given the index' recent success, the Nasdaq is most likely going to draw a lot of investors' attention, which, in turn, could only lead to the emergence of even more significant underlying price swings. Hence, the expectation for substantial trading action on the Nasdaq in the forthcoming weeks and months justifies the need for a comprehensive examination of the index' current performance.
1. Long Term Outlook:
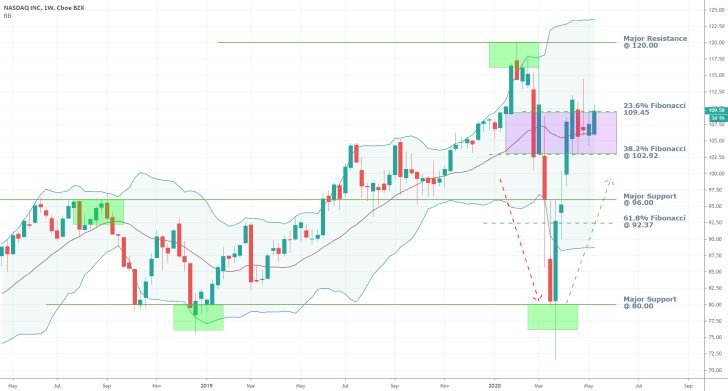
As can be seen on the weekly chart below, the Nasdaq, too, has suffered massive losses in the wake of the coronavirus crisis, which can be attributed to the suddenness of the developments and the resulting market shock. The index, however, has subsequently managed to bounce back up, creating a distinctive V-Shaped correction.
The low point of the selloff has been reached at the 80.00 price level, which has already been confirmed as a major support level. The quick reversal at that point illustrates the massive scope of the underlying buying pressure in the market. This makes any future tumbles of the price action to or below that level highly improbable.

Over the past several weeks, the price action has been contained within a narrow range, with an upper boundary represented by the 23.6 per cent Fibonacci retracement level at 109.45, and lower boundary represented by the 38.2 per cent Fibonacci retracement level at 102.92. The week before last has even seen a major attempt at a break out above the range's upper limit, which ultimately failed.
This behaviour underpins the commitment in the market to continue establishing the broader bullish correction, which is now being checked by increasingly adverse selling pressure. Consequently, the bullish market is now likely to become less pronounced, manifested by the emergence of random price fluctuations that are bigger in size and also more frequent.
It remains to be seen whether the currently developing range-trading environment would have the capacity to terminate the preceding bullish trend. In relation to the Bollinger Bands, the price action continues to be trading above the instrument's middle line, which demonstrates that the bullish commitment in the market continues to be prevailing over the bearish pressures despite the recent fluctuations.
Overall, the price action is likely to continue consolidating between the middle line of the BBs and the range's upper boundary at the 23.6 per cent Fibonacci retracement level in the near term, before it gets ready to continue heading further north. Once the price manages to break out above the aforementioned range, the next target for the bullish trend would be the major resistance level at 120.00.
2. Short Term Outlook:

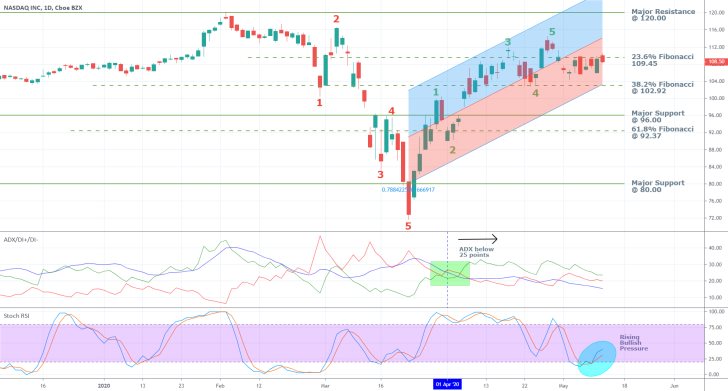
As can be seen on the daily chart above, the ADX is threading below the 25-points threshold, which confirms the existence of the expected range-trading environment in the short run. Meanwhile, the Stochastic RSI has recently picked up from the 'Oversold' extreme, which underlines the rising bullish pressure in the short run that is complimenting the broader bullish sentiment in the market. Consequently, the market might be close to gaining the necessary support in order to finalise the anticipated breakout above the crucial resistance level at 109.45.
On the other hand, the market has recently concluded establishing a bullish 1-5 impulse wave, which favours the continuation of the current range's development. In other words, the Nasdaq is likely to eventually continue heading higher, but in the short run the index looks set to continue trading horizontally, judging by the Elliott Wave Theory.
A renewed bullish trending environment can be confirmed once the price action manages to break out above the 23.6 per cent Fibonacci retracement level, in addition to the ascending channel's middle line.
3. Concluding Remarks:
The Nasdaq index has gained significant momentum over the last several weeks, owing to the robust performance of Big Tech firms, and the US technological sector in general. This would undoubtedly benefit its price action, which is likely to continue trading higher in the following weeks.
Regardless, the price action currently finds itself consolidating within the boundaries of a narrow range. It would have to decisively break out above the range's upper edge before the market bulls can hope for the continuation of the broader uptrend's development.

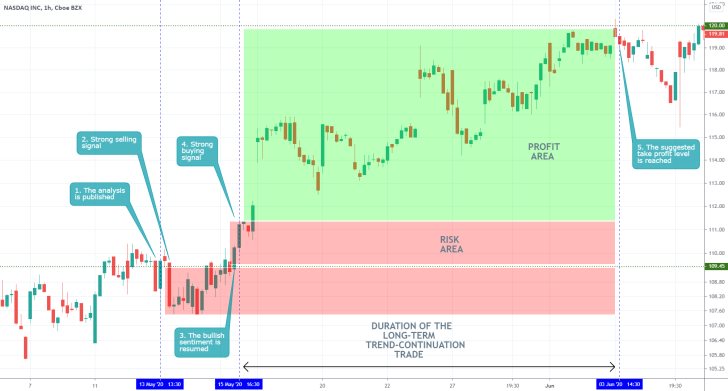
- A classic trend-continuation setup. The price action broke out above the resistance level, which signalled the execution of a buying order. Well-executed with tight levels of resistance and support.
Disclaimer: Your capital is at risk! Trading and investing on the financial markets carries a significant risk of loss. Each material, shown on this website, is provided for educational purposes only. A perfect, 100% accurate method of analysis does not exist. If you make a decision to trade or invest, based on the information from this website, you will be doing it at your own risk. Under no circumstances is Trendsharks responsible for any capital losses or damages you might suffer, while using the company’s products and services. For more information read our Terms & Conditions and Risk Disclaimer.


