The EURUSD appears to be undergoing through another fundamental change – the temporary role of the euro as a safe-haven pandemic currency, which was bestowed upon the single currency during the summer months of this year, is now being challenged. The exponential uptick of COVID-19 cases across Europe has prompted many governments to reimpose stricter containment measures, and many social commentators have started to weigh in on the likelihood for the adoption of a new wave of lockdowns across the continent.
The scope of the economic toll on the fragile recovery of the Eurozone would depend on the strictness of Europe's readjusted response to this second coronavirus wave. There is mounting evidence suggesting that European industry is about to suffer a second downturn by the end of the year as the epidemic conditions tighten.
All of these developments are likely to exert extra pressure on the euro, which is currently facing increased odds of depreciating in the next following weeks. Meanwhile, the global markets have started to price in an almost certain Joe Biden victory in the upcoming US elections, which would likely alleviate some of the greenback's pains. Chiefly, the uncertainty stemming from the presidential race is likely to diminish as the election date comes closer.
So, unless there is a significant last-minute development and Donald Trump snatches a surprising victory, the outcome of the election is unlikely to stir massive shockwaves in the global capital markets this November. Hence, the underlying fundamental landscape seems favourable for a forthcoming depreciation of the euro and appreciation of the dollar.
1. Long-Term Outlook:
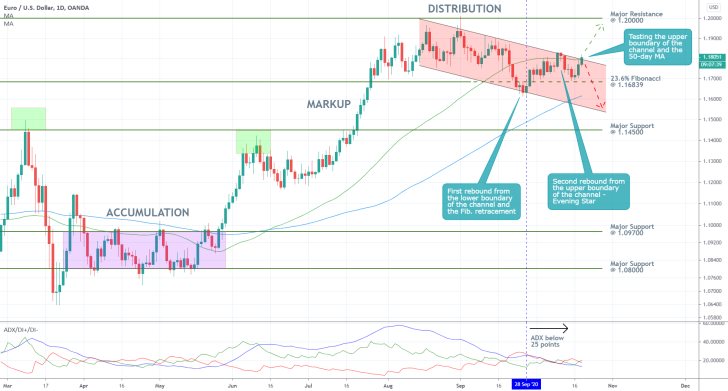
As can be seen on the daily chart below, the price action of the EURUSD has been trading within the confinements of a massive Distribution range, spanning between the major resistance level at 1.20000 and the 23.6 per cent Fibonacci retracement level at 1.16839, since the end of July. The existence of this range-trading environment is further substantiated by the ADX indicator, which has been threading below the 25-point benchmark since the 28th of September. Such consolidation ranges are typically followed by new Markdowns, as postulated by the Wyckoff Cycle theory, which is inlined with the above-mentioned fundamental assertions.
Despite this apparent confluence of long-term technical and fundamental signals, inferring the emergence of a new downtrend right away rate would be premature at best. The price action is currently testing the strength of the upper boundary of the descending channel, which in itself underscores the existence of strong bullish pressure at present.
If the price action manages to decidedly break out above the 50-day MA (in green), which is serving the role of a floating resistance, and the upper edge of the channel, then it would be free to target the psychological resistance level at 1.20000 next. Conversely, if the price rebounds from the MA and breaks down below the 23.6 per cent Fibonacci, then the market would be ready to begin developing the new downtrend. The major support level at 1.14500 would represent the first crucial test for such a Markdown.
Notice, additionally, that the 100-day MA (in blue) serves the role of a floating support, which could potentially deter the development of a massive downswing below it for the time being.
2. Short-Term Outlook:
As can be seen on the 4H chart below, the Stochastic RSI indicator currently finds itself in the 'Overbought' extreme, which, given the aforementioned range-trading environment, entails the likely emergence of a new downswing in the near future. Nevertheless, the current bullish momentum would have to be exhausted first.
Notice also that the price action behaves as per the expectations of the Elliott Wave Theory. Chiefly, it tends to develop clearly discernible impulse waves. If the currently emerging bearish 1-5 impulse wave (in red) is to be completed fully, then the latest upswing SHOULD NOT exceed the peak at point four – in other words, the price action should be reverted within the Test Area.
Therefore, the bears should be looking for signs of a reversal within set area, which could potentially indicate that the market would be ready to establish the final impulse (4-5). This means that for as long as the broader 1-5 EWT pattern continues developing, the bearish projections would entail a likely dropdown anywhere below the recent dip (at point three).
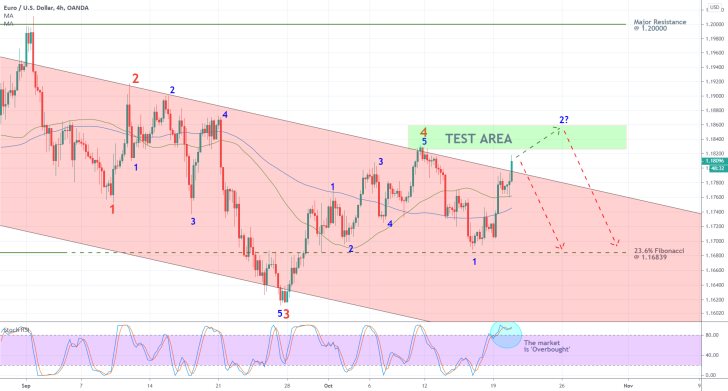
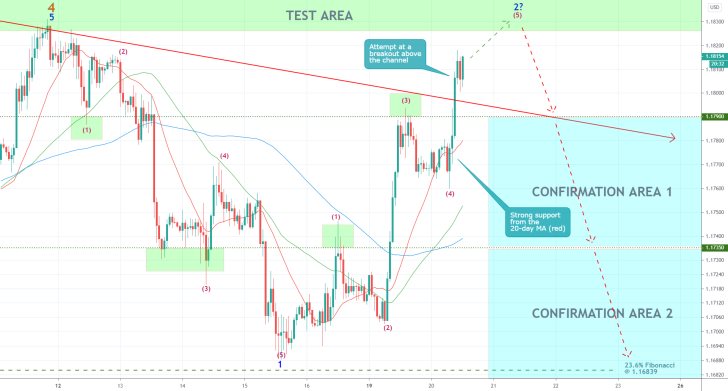
The needed confirmation for a reinstated bearish sentiment in the short-term would take the form of a throwback below the descending channel's upper border. In other words, a reversal from the Test Area, and a subsequent break down below the 1.17900 level and penetration of the Confirmation Area 1. A break down below the 1.17350 level, which separates Confirmation Area 1 from Confirmation Area 2, would give the market bears further incentive to expect further dropdowns in the near future.
3. Concluding Remarks:
The underlying trading opportunity can be utilised using trend-reversal strategies. As was mentioned earlier, the bears should wait for a confirmation of the recent upswing's exhaustion before they join the broader downtrend.
Since the execution of short orders would aim to catch the establishment of a new massive Markdown emerging from the current Distribution, traders should be aware that the transition would likely be protracted and volatile. Hence, they should prepare for erratic fluctuations and potential false breakdowns.
Swing trading strategies can also be used around the test area, provided that the price action fails to continue appreciating above it, and a new rebound takes place.
Classic ABCD Pattern Possibly in the Making
A classic bullish ABCD pattern could be emerging on the EURUSD's price action since the last analysis was published, which entails excellent trading opportunities (if, of course, the pattern is fully realised).
As regards the underlying fundamental outlook, the deepening coronavirus crisis in Europe, encapsulated by the continually surging number of COVID-cases, is inducing an ever-growing hit on the general economic activity in the Eurozone. Consequently, the pressure that is being exerted on the euro is expected to increase steadily parallel to the spike of confirmed cases. This hit is affecting the industrial activity in the bloc noticeably, as seen by the troublesome services numbers in Germany that were published earlier today.
Meanwhile, across the pond, the growing lead in the preliminary polls of former Vice President Joe Biden has staved off some of the uncertainty emanating from the Presidential Elections. As the gap between the democratic candidate and current President Donald Trump widens, so does the overall uncertainty diminish. These recent developments have had a positive impact on the value of the greenback so far, with investors betting on a more than likely victory for Joe Biden.
The long-term expectations regarding the EURUSD continue to be tilted towards the downside, with a trend reversal being the most likely outcome. Nevertheless, the pair is showing little signs of slowing down at present, which means that the rally could be extended a little longer before the bears regain full control. Given these projections for a protracted transition of the underlying market sentiment from being ostensibly bullish into becoming predominantly bearish, it is worthwhile to examine the prospects for the emergence of a classic ABCD pattern.
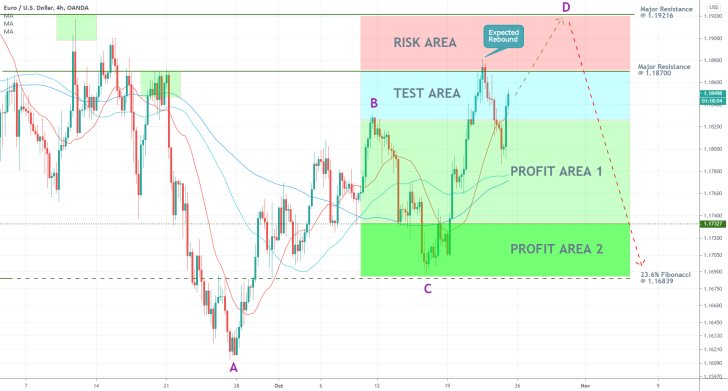
As can be seen on the 4H chart above, the price action expectedly rebounded from the major resistance level at 1.18700, as was postulated in the initial analysis. For the time being, the price action remains concentrated within the Test Area, which was previously seen as a likely reversal range. However, given the continued prevalence of the underlying bullish pressure, those initial projections need to be revised.
The price action could advance towards the major resistance level at 1.19216 before such a reversal develops. Firstly, this resistance level served as the previous swing high, which makes it a logical contender for a new such turning point in the direction of the price action. Secondly, at around 1.19216, the price action would have established a classic ABCD pattern, which represents a major trend reversal structure.
At that resistance level, the length of the CD leg would match the length of AB, which is the first major prerequisite for applying trend-reversal strategies to this particular setup. Secondly, it is anticipated that it would take the price action several more trading days to reach set target level, which would mean that the duration of the CD leg would be the same as the duration of AB – another major prerequisite.
Thirdly, at the aforementioned resistance level, CD would be exactly 161.8 per cent of AB – the final condition necessary for using trend-reversal strategies. Hence, contrarian traders could monitor the future behaviour of the price action, provided that it manages to break out above the Test Area and comes close to the upper boundary of the Risk Area, with the intent to open short positions. Depending on the significance of the new bearish commitment, once such a reversal takes place, the resulting downswing could fall as low as the 23.6 per cent Fibonacci retracement level at 1.16839.
ECB's Idleness Detrimental for the Euro
At a monetary policy meeting earlier today, the Governing Council of the European Central Bank decided to postpone any recalibrations to its monetary policy stance until December, when it expects to have more data. The decision effectively means that the already strained euro will not be receiving any support by the Bank at least until the end of the year, which, as was argued in our breakdown of the decision, could spell trouble for the struggling single currency.
The EURUSD already fulfilled the expectations of our previous follow-up of the pair, in that the price action tumbled to the 23.6 per cent Fibonacci retracement level at 1.16839 (as can be seen on the 4H chart below). Given the developments from today and the worsening epidemic conditions in Europe and elsewhere, the woes for the pair are only likely to be exacerbated in the following days and weeks.
That is why the second follow-up of the original EURUSD analysis is dedicated to examining just how low the pair could go in the near future.
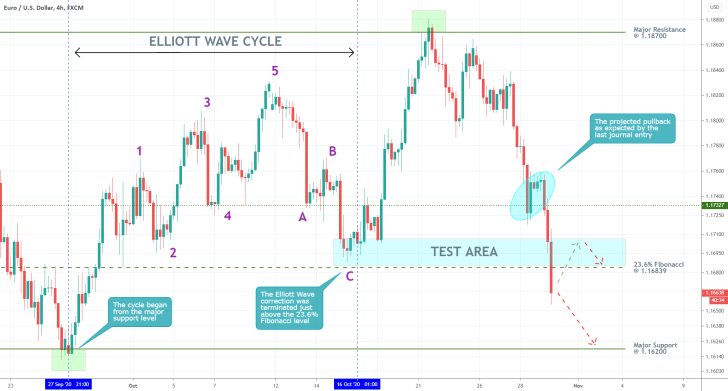
Before determining whether the price action is overdue for a new bullish correction or it would head immediately towards the next logical target level at 1.16200, it is worthwhile examining its behaviour between the 27th of September and the 16th of October. Within the span of set period, the price action established a quite clearly discernible bullish 1-5 impulse wave pattern that was followed by a corrective ABC pattern.
Notice that the latter was terminated just above the 23.6 per cent Fibonacci retracement level, which established a subsequent 'Test Area'. In other words, the area in light blue would serve the role of a likely turning point for future dropdowns and upsurges.
In breaking down below it, today's price action did not change directions, as the ECB decision exerted a heavy selling pressure on the euro. Nevertheless, one should keep in mind that the price action is currently being driven largely by the fundamental external forces, as the market is still in the process of discounting ECB's decision. In other words, the likelihood of a bullish correction emerging soon is going to be increased as the overall levels of adverse volatility in the market start to wane.
At any rate, even if a bullish correction is to emerge right away, it is likely to be terminated below the 23.6 per cent Fibonacci level, which has assumed a new role of a prominent resistance, or from the upper boundary of the 'Test Area' at the latest. Meanwhile, both the underlying technical and fundamental indications seem to point to a very probable tumble towards the aforementioned support level at 1.16200 in the near future.
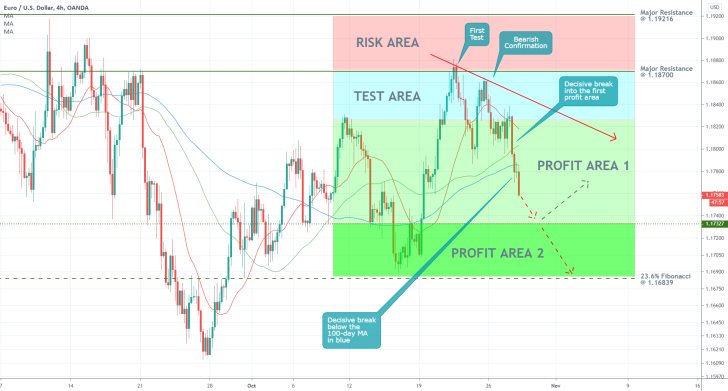
- The expectations for the emergence of a new downswing were realised sooner than it was initially projected in the last follow-up. After the price action failed to break out into the 'Risk Area', it went on to establish a subsequent lower peak (the bearish confirmation), which signalled that the market was now ready to go lower. The following decisive breakdowns into the 'Profit Area 1' and subsequently below the 100-day MA (in blue) substantiated these bearish expectations. This is a good example of why monitoring the pivot swing lows and swing highs ahead of an anticipated trend-reversal is so important for gaining favourable entries.
- At present, the price action is headed towards the next crucial target level 1.17327, which could act as a temporary turning point (prompting a potential bullish pullback). Next, the price action would likely target the 23.6 per cent Fibonacci retracement at 1.16839, which represents the final psychologically significant target level.
- Keep in mind that the ECB is due to meet tomorrow, which could prompt heightened adverse volatility.
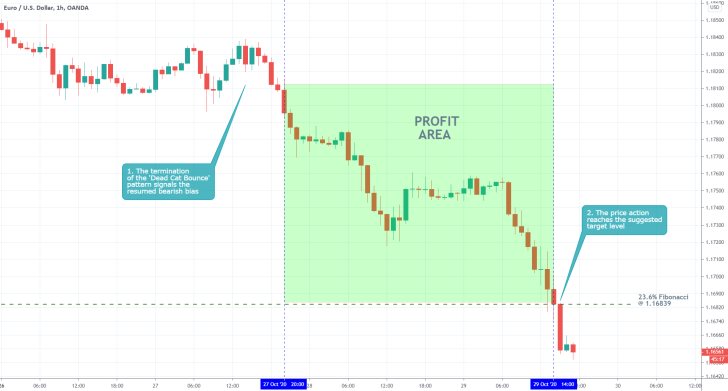
- The timely publication of the previous journal entry led to the execution of a perfect trend-continuation trade, as the EURUSD reached the anticipated support at the 23.6 per cent Fibonacci retracement level.
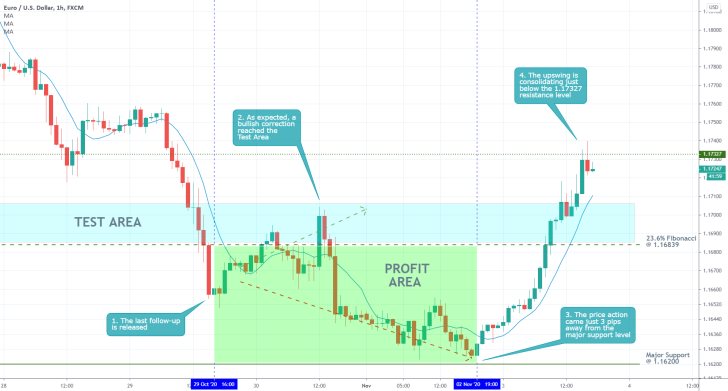
- The projections of our last follow-up of the pair went on exactly as expected. After a minor bullish correction towards the upper boundary of the Test Area, the price action went on to fall to the major support at 1.16200 (it actually came at just 3 pips away from the mark).
Disclaimer: Your capital is at risk! Trading and investing on the financial markets carries a significant risk of loss. Each material, shown on this website, is provided for educational purposes only. A perfect, 100% accurate method of analysis does not exist. If you make a decision to trade or invest, based on the information from this website, you will be doing it at your own risk. Under no circumstances is Trendsharks responsible for any capital losses or damages you might suffer, while using the company’s products and services. For more information read our Terms & Conditions and Risk Disclaimer.


