The Japanese Yen is one of those financial assets that typically become especially sought after at times when there is sweeping uncertainty in the market is leading to heightened fear amongst traders and investors. Investors, in particular always seek to move their capital to assets that are frequently referred to as safe-havens when there are talks of potential crashes. Such assets are thought to involve less overall risk due to their stability at times of uncertainty and panic across the market.
Currently, the outbreak of the deadly coronavirus is becoming increasingly more dangerous by the day, and some popular media sources have already begun to weigh in on the virus's capacity to harm the currently recovering global economy. The general conditions on the market are such that favour heightened trading activity on the USDJPY, which, in turn, creates some very advantageous short-term trading opportunities on the pair. Therefore, the purpose of this analysis is to underpin those opportunities and present the reader with the most likely development of the USDJPY's price action in the foreseeable future.
1. USDJPY’s Long-Term Outlook:
Before a thorough examination of the pair’s immediate price action can be advanced, it will be prudent to have a look at the more persistent trends in the USDJPY’s longer-term price action.
The price has been consolidating in an increasingly narrower triangle formation on the weekly chart, which underscores the progressively diminishing levels of volatility. It, therefore, becomes clear that the price action is currently being contained within the boundaries of an increasingly narrower range, which means that eventually, the price would break out or correspondingly break down below those boundaries, and form a new trend. Thus, the most pressing questions are for how long can this range trading environment be extended; in which direction would the price head next and what would be the signs of this eventual breakout/breakdown?
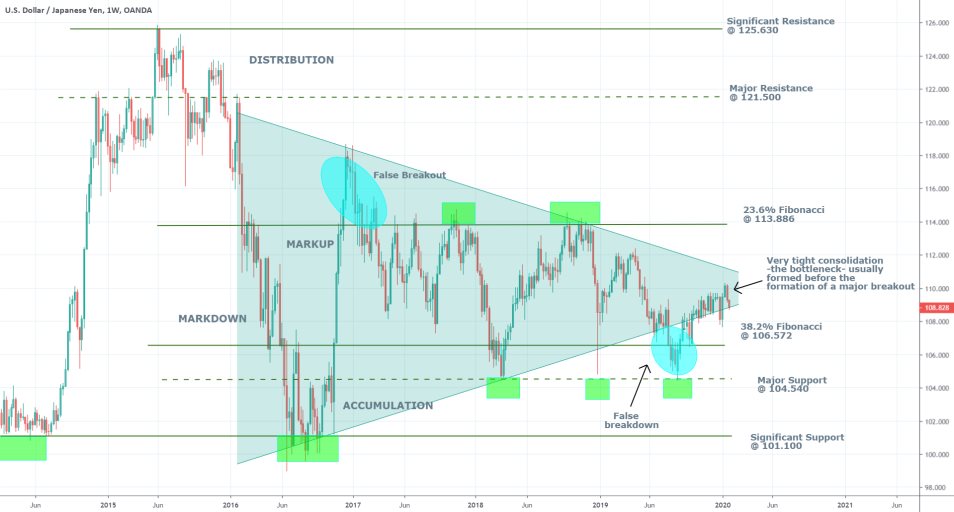
The price action is currently contained within two very important Fibonacci retracement levels – the 38.2 per cent support at 106.572 and the 23.6 per cent resistance at 113.886. Additionally, the price is consolidating within the boundaries of the aforementioned triangle, and it appears as though the formation is very close to its completion (when the two legs meet and thereby form the third angle). The termination of the triangle would be a reliable indication of the likely exhaustion of the current range's strength and possibly the beginning of the subsequent trend. Thus, the currently developing 'bottleneck' pattern could very likely indicate the beginning of the transition stage from range trading to trend trading. It could take up to several weeks before this transition process is fully completed, and the range is entirely terminated.
The price is currently trading on the triangle’s lower boundary following the formation of a false breakdown to the major support at 104.540. The price’s rebound from that support level indicates its strength and significance. The question is whether the current geopolitical environment is going to create the necessary conditions for the USDJPY bears to finally manage to break down below the triangle's lower leg successfully, or whether the bulls would manage to prevail and come on top.
2. The Three Big Fundamentals:
- The Current International Trade Situation. Currently, there are three crucial fundamental points to consider before trading on the USDJPY, and the international trade conditions are one of them. The signing of Phase One in the US/China trade negotiations has already been covered a lot by media outlets worldwide. The hopes globally where that after the signing of this preliminary deal, the fragile world economy would become increasingly more stable as global trade uncertainty diminishes. All other factors aside for a moment, such an environment should result in at least a partial selloff in the dollar.
That is so because prior to the signing of the aforementioned deal, the rally in the greenback was mostly driven by investors betting on the US economy ultimately overcoming in the trade dispute with China. Now that the situation is somewhat de-escalated and the attention of the public is at least temporarily moved away from the trade war, the rally in the US dollar should theoretically no longer be supported by international trade speculations. Thus, as regards this first factor, there is ample evidence suggesting a likely forthcoming selloff of all currency pairs in which the USD is a base currency, the USDJPY included.
- The Chinese Deadly Virus Outbreak. The second key factor to consider is the currently uncontained outbreak of the Wuhan virus. As fears and uncertainty rise worldwide, one of the casualties of the resulting panic is the stock market, as some indices have already been hit. Overall, it can be seen how the previous uncertainty, which was fuelled by the US/China trade war, is now changing its form to a different type of uncertainty – whether the panic from the spread of the virus would cause a new recession. The changing nature of the market uncertainty can be observed in the following image, which demonstrates the VIX (an index that measures the volatility levels of the S&P 500):
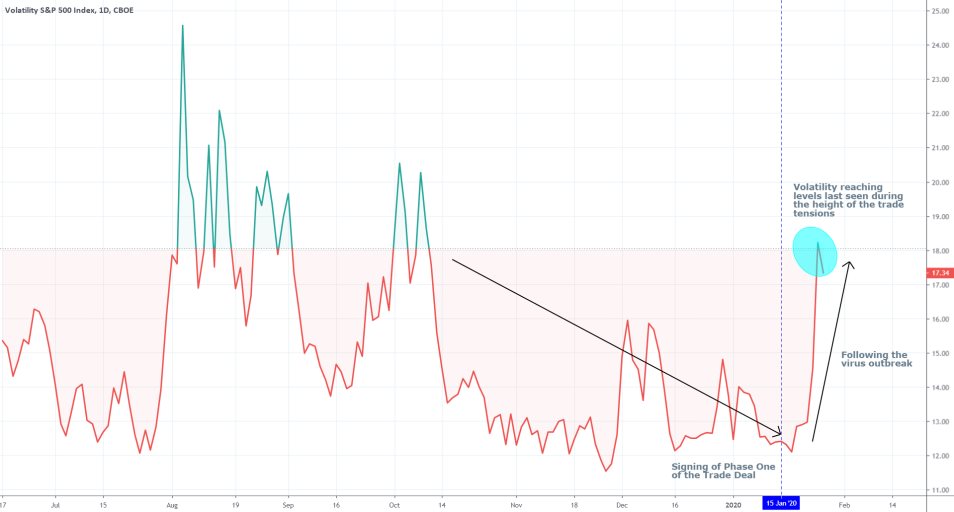
The adverse volatility was gradually diminishing, leading up to the signing of the aforementioned Phase One Deal on the 15th of January, however, it started rising once more afterwards because of the Wuhan virus's outbreak. The volatility levels are now reaching levels that were last seen at the height of the trade war last year. The VIX, which typically can be used as a gauge for market uncertainty, graphically represents the impact of the rising concerns on the stock market. Hence, the volatility index can also be used as an indication of the sweeping panic across the market, which has not yet reached harmful levels. Nevertheless, as the value of the VIX continues to rise (if it does), the demand for safe-haven assets would also increase parallel to the growing uncertainty. Consequently, the demand for the Yen would also be rising at a comparable pace.
- FED’s Interest Rate Decision. The third and final determining factor to consider is this week’s gathering of the FOMC and its deliberation on the monetary policy in the US. The Committee is anticipated to keep the interest rate unchanged at its current 1.75 per cent value. From the post-meeting monetary policy statement would become clear the FOMC's opinions on the current state of the US economy and the members' expectations for near-term growth. They would also most likely shed light on the most pressing questions regarding their current monetary policy – when can future hikes in the rate be expected. Meanwhile, if the Committee does indeed release a dovish monetary policy statement, the dollar is likely to take a hit and continue its stumble. Therefore, there is another reason to expect a fall of the USDJPY’s price, albeit a more ambiguous reason compared to the other two. Nevertheless, the overall situation presupposes a very likely tumble of the USDJPY. Consider the following daily chart:
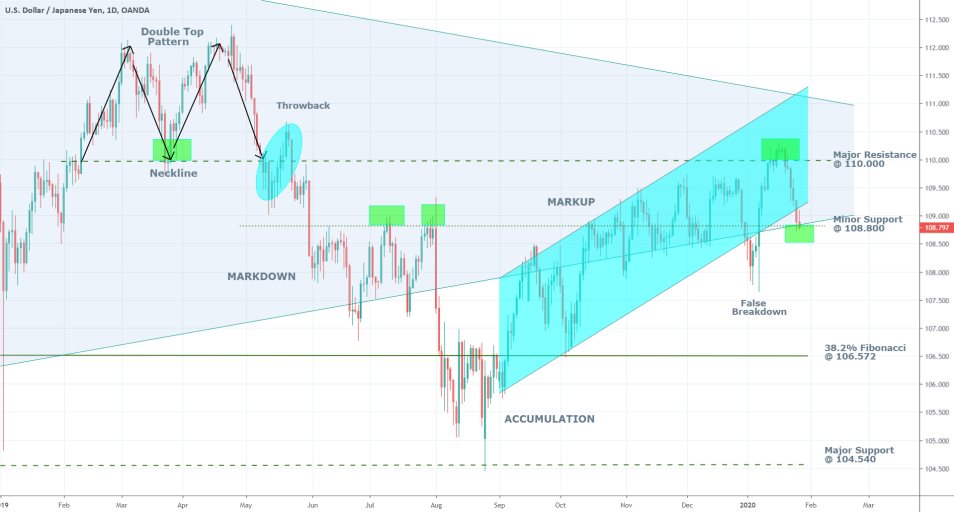
The price has failed to break out above the major resistance at 110.000, which has psychological importance due to the four zeroes in addition to being the neckline of the previous double top pattern. Thus, the bearish momentum is becoming increasingly stronger. The price is currently attempting to break down below the ascending channel's lower boundary and the minor support level at 108.800. If it succeeds in doing so, the market sentiment will become even more bearishly-oriented, which would be enough for the execution of a short order.
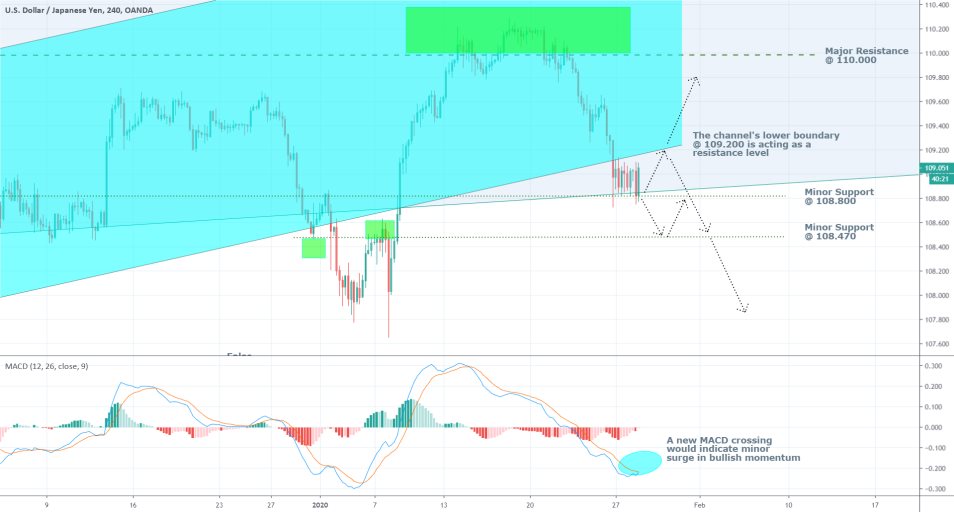
The above 4H chart illustrates very clearly the current consolidation of the price just above the minor support level of 108.800, which should be considered as a possible attempt at a new breakdown. The price could, however, first bounce back to the channel's lower boundary before it finds the necessary bearish conviction. If it continues to extend its gains above that level, the bearish sentiment would clearly be insufficient, and thus all short orders should be closed out.
If the price instead breaks down below 108.800, the next crucial level would be the minor support at 108.470. False breakdowns could form within the boundaries of this minor range. Thus, a successful short position would require the price breaking down below the two minor support levels.
3. How to Execute a Short Position:
All things considered, the execution of a short trade seems the most reasonable decision in the current situation. The biggest threat to such a position would be the possible formation of a new false breakdown. Thus the reader should be especially cautious of the immediate development of the market. Additionally, as the market starts to move in the direction of the underlying position, it might be beneficial for the preferred stop-loss to be moved further below in order to decrease the potential losses.
Entry Level – either at the current market price (109.020) or 5-10 pips below the minor support at 108.800 after the price manages to break down below it.
Stop-loss – In the first case, the stop-loss should be placed at 109.250. In the second case, the stop-loss should be placed at least 25 pips above the initial entry.
Take Profit – the first major target level is the dip of the previous false breakdown at 107.900. The longer-term target would be the 38.2 per cent Fibonacci retracement 106.572
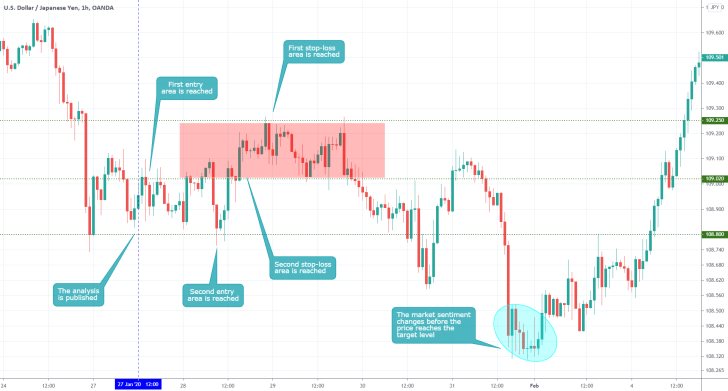
- Two potential trades were suggested here and the stop-loss was reached on both occasions, resulting in roughly 50 pips loss (combined). The issue with the second proposition was that the suggested entry level was too low, leading to an almost instantaneous reversal after the trade was initiated. The first propositioned fared better, even though its stop-loss order was also triggered. It is worth to mention that the price action rose only 1-2 pips above the SL before changing directions yet again, and heading back south. The big takeaway here is that traders should be prepared psychologically to deal with such "bad luck" outcomes. Sometimes the difference between a successful and unsuccessful trade can be measured in few pips. Traders should accept that and refrain from neglecting their risk management strategies in order to avoid such scenarios. After all, such instances are very rare and do not require fundamental changes to the underlying trading strategy.
Disclaimer: Your capital is at risk! Trading and investing on the financial markets carries a significant risk of loss. Each material, shown on this website, is provided for educational purposes only. A perfect, 100% accurate method of analysis does not exist. If you make a decision to trade or invest, based on the information from this website, you will be doing it at your own risk. Under no circumstances is Trendsharks responsible for any capital losses or damages you might suffer, while using the company’s products and services. For more information read our Terms & Conditions and Risk Disclaimer.


