The most important stocks index in the US continued to register marginal gains during yesterday’s trading session and reached a new all-time high at 3385.5 before closing the session a little bit lower than that. Many investors and traders are currently wondering whether the remarkable stretch of considerable growth would be sustained in the next few months given the expected surge in adverse volatility that is likely to hit the markets. On the one hand, the outbreak of the novel coronavirus, which has been dubbed COVID-19, is a major impediment to the security of global trade as it jeopardises the fragile recovery of the Chinese economy, which recently recorded its mildest growth rate since 1992. On the other hand, the upcoming presidential election in the US is very likely to add more uncertainty to the markets. The Americans seem to be hard-pressed to make a profound choice – the protectionist economics of Donald Trump, frequently referred to as Trumponomics, versus the controversial centre-left economic inklings of the Democratic party and its champions - Bernie Sanders and Joe Biden.
Even though most central banks estimate that global economic headwinds have lessened so far in 2020, the adverse uncertainty is not yet completely removed and could pose a serious threat to the already struggling and fragile global economy. The S&P 500 (SPX) is one of those crucial indices which reflect on any ripples in the US economy as well as on the global economy. That is why the current analysis is dedicated to evaluating the present state of the index and whether there are any signs of a potential selloff in the US stock market.
1. Long-Term Outlook:
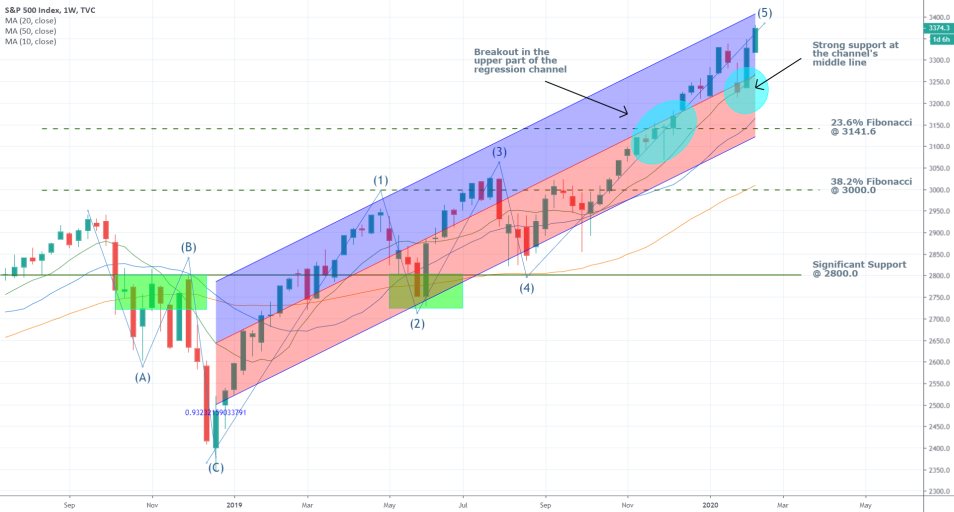
Looking at the weekly price chart below, it can be asserted that the index continues to thread in a powerful bullish channel. The regression channel illustrates the behaviour of the price action during the development of set trend. The price is positioned at the upper part of the channel, which demonstrates strong bullish sentiment in the market. Moreover, the price jumped upwards from the channel's middle line last week, which is illustrative of strong support currently prevailing in the market. Even though all of these indications point to a firm bullish commitment, it should be noted that this does not necessarily mean that the price would continue rising indefinitely. If the price starts to consolidate below the channel’s upper-boundary, this could be an early indication of waning bullish commitment below set resistance and a potential formation of a trend reversal pattern.

The bullish momentum is further confirmed by the 'Perfect Order' in which the three moving averages (20-day; 50-day and 100-day) find themselves in relation to each other. If the market sentiment were to change to become more distinctly bearish, then the first significant indication of this would be a crossover between the 20-day MA and the 50-day MA. For now, however, the market remains with decidedly bullish commitment.
As per usual, Elliott Wave Theory is another comprehensive system that can be applied when analysing such trending environments. The 1-5 Elliott Impulse wave postulates that there are five essential price levels in the development of every trend – 3 highs and 2 dips for bullish trends. As can be seen from the chart above, the price has already finished establishing the two pullbacks at 2 and 4, which means that it is currently in the process of developing the final impulse wave at 5. It should be mentioned that 5 is not necessarily established at the current high and instead, it could end up being higher if the price continues to appreciate. Additionally, the conclusion of such a 1-5 pattern does not necessarily imply that there is going to be an opposite trend immediately following the termination of the current one. Instead, the price could either end up consolidating before it resumes going north, or it could create a major correction such as the ABC pattern presented above. Therefore, even though the price currently finds itself threading towards the final stages of the current 1-5 Elliott impulse wave, the establishment of a new bearish trend would require significant changes in the underlying fundamental factors.
If, however, the price does indeed move forward to establish a new major ABC correction, two important price levels have to be considered as likely supports in a potential bearish correction. The first is the 23.6 per cent Fibonacci Retracement level at 3141.6, and the other is the 38.2 per cent Fibonacci Retracement at 3000.0, which also has psychological importance due to the zeroes in the number. Both levels represent likely turning points in a potential bearish correction, where the price is likely to change its direction and resume trading higher.
2. The Impact of COVID-19 and Trump’s MAGA Policy:
At the present rate, two external factors could be of fundamental importance for the subsequent development of the SPX's price action.
On the one hand, there is the pressing issue of containing the spread of the novel coronavirus. The most recent developments in the overall situation include the introduction of new measures for screening and detecting the disease in patients by the Chinese government. As of Wednesday, Chinese authorities have started to use new screening techniques for identifying the elusive disease in the Wuhan province – the place of origin of the epidemic – and elsewhere in China. As a result of the implementation of this new methodology, there was a surge in confirmed cases in the past couple of days, which is why some officials struggle to estimate whether the outbreak has already peaked or whether it is going to continue escalating. Hence, apart from the general panic that stems from COVID-19’s spread, now there are concerns that the gathered statistics regarding the virus’ mortality and contamination rate may be inefficient, which would make the task of dealing with the epidemic that much harder. Consequently, the overall uncertainty that revolves around the nature of the virus can be said to have increased over the past two days, which is likely to weigh in on global stocks, including the SPX.
On the other hand, there is the upcoming Presidential election in the US this November. Flying high after the conclusion of the impeachment trial in Congress, Trump is now free to resume his preparation for the upcoming election. It is almost impossible to try and frame his character as he has proven time and time again how unpredictable he can be, especially on social media. Nevertheless, it would be a fair assumption to expect him to resume his ‘America First’ and ‘MAGA’ policies ahead of November.
.@AugustPfluger is a Great Veteran and Strong Leader for Texas where he is running for Congress. He will protect your #2A, fight for our Farmers, Oil/Gas Workers, and he supports our #MAGA & #KAG Agenda. August has my Complete and Total Endorsement! https://t.co/aodsb5LWJz
— Donald J. Trump (@realDonaldTrump) February 12, 2020
Such populist slogans and propaganda-like techniques have guaranteed his massive following in the past, which makes it a safe bet to expect him to provide more of the same in the following months in a bid to secure the necessary support in the upcoming presidential campaign.
.@WesleyHuntTX is running for Congress in the Great State of Texas. He will help us accomplish our America First policies. Wesley is strong on Crime, the Border, our 2nd Amendment, Trade, Military and Vets. Wesley has my Complete and Total Endorsement! https://t.co/tdnO5Uh5Sa
— Donald J. Trump (@realDonaldTrump) February 12, 2020
Such talks of protectionist policies and economics driven by the 'America First' agenda are likely to boost investors' enthusiasm and, in turn, bolster US stocks in the forthcoming months. Thereby, the American stock market is likely to be especially politicised leading up to the election date in November. This would likely prompt higher volatility, sudden movements in the price action, but also stimulate more gains in the SPX index, driven by investors’’ speculation.
3. Short-Term Outlook:
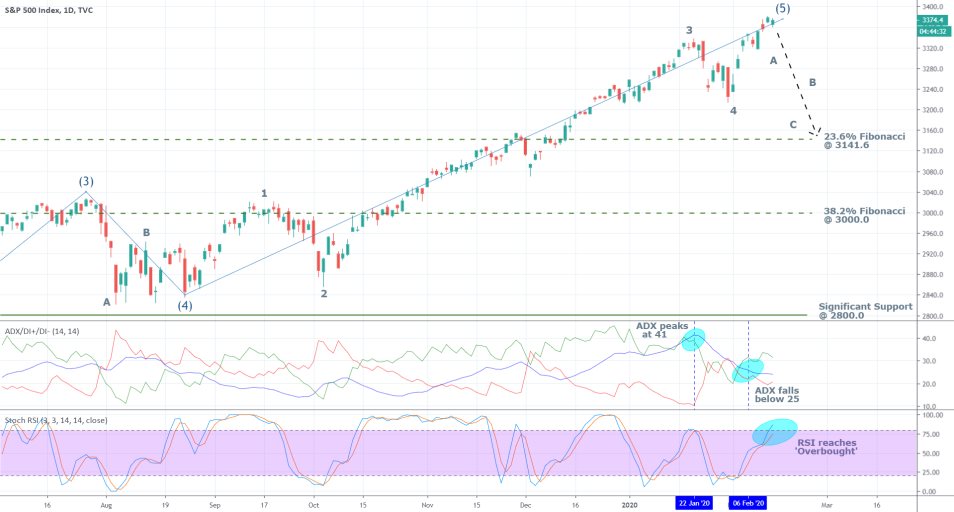
The daily price chart below reveals that the strength of the current trend is not especially solid since the ADX is threading below 25 index points. The price, however, is not range trading. Because of that, the Stochastic RSI indicator can be used to determine what is the current volume that is being transacted in the market. It reveals that the price action is currently close to entering the 'Overbought' extreme, which could potentially prompt the bears in the market to start executing short orders.

The daily chart is not meant to suggest that a bearish downswing is necessarily going to occur, as the overall bullish sentiment continues to be prevalent (look at the beginning of point 1). However, it does highlight the likely development of a potential bearish correction, if one were to take place shortly because of the rising coronavirus uncertainty.

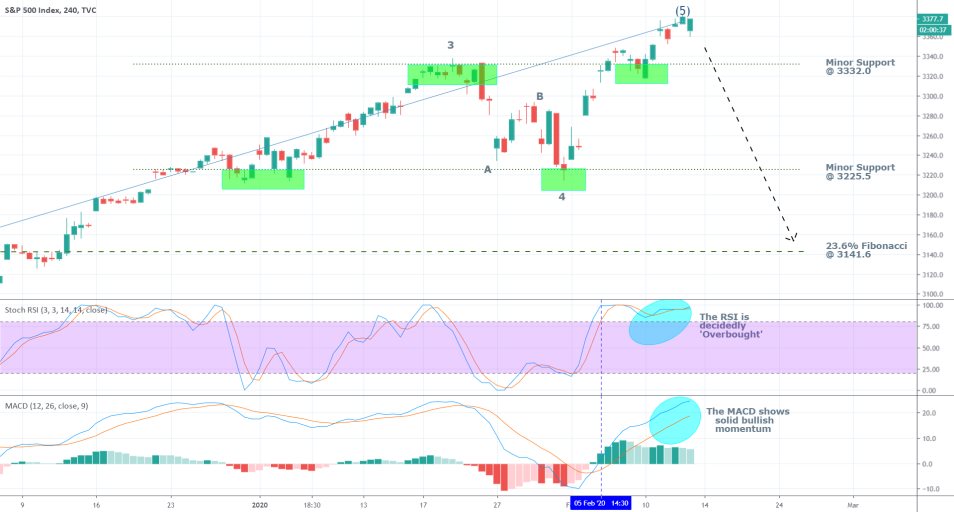
The 4H price chart above demonstrates strong bullish momentum in the short term, as shown by the MACD. However, the RSI has been threading in the ‘Overbought’ area since the 5th of February. These two factors do not necessarily project a forthcoming bearish correction; however, they could prompt some traders to start executing short orders.
4. Concluding Remarks:
Overall, the S&P 500 is likely to continue trading higher in the long-term, especially given the aforementioned projections for increased populist statements, the likes of which have previously bolstered the index due to heightened investors' speculation. In the short-term, however, some indications are suggesting the likely formation of a new bearish correction, which could be prompted by the rising uncertainty revolving around the spread of COVID-19.

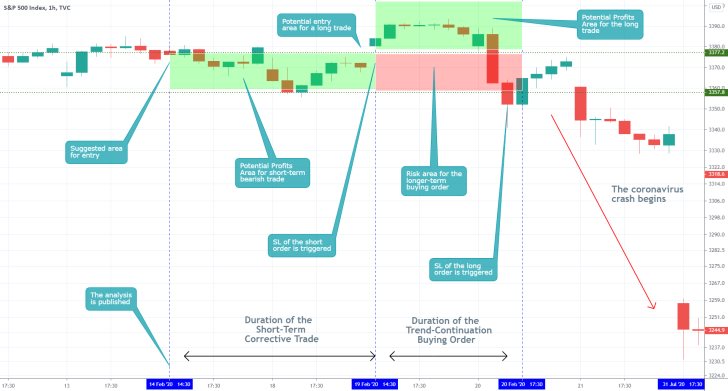
- In hindsight, the analysis completely failed to interpret the danger of the coronavirus crisis immediately before the crash. The initial selling order in the short-term started off well, gaining 5-8 basis points in running profits, but then the price changed directions. This was perceived as an indication that it was OK to place a new trend-continuation trade on the presumption that the bullish momentum would persist. Both trades resulted in losses due to the adverse fluctuations that were caused by uncertainty from the brewing coronavirus crisis at that time. The biggest takeaway here is that it is extremely dangerous to try an interpret minor aspects of a situation that is as historically significant as the coronavirus crisis would prove to be. Furthermore, one should remember that when the market is going through such turbulent times, the underlying liquidity is likely to be very sporadic, which leaves traders exposed to the possibility of being trapped on the wrong side of the market with no liquidity to close their positions. In other words, it is much better to stay out of the market at such times.
Disclaimer: Your capital is at risk! Trading and investing on the financial markets carries a significant risk of loss. Each material, shown on this website, is provided for educational purposes only. A perfect, 100% accurate method of analysis does not exist. If you make a decision to trade or invest, based on the information from this website, you will be doing it at your own risk. Under no circumstances is Trendsharks responsible for any capital losses or damages you might suffer, while using the company’s products and services. For more information read our Terms & Conditions and Risk Disclaimer.


