Some traders like to think of CADJPY as a commodity-driven pair, given the loonie’s strong correlation with the price of crude oil and the yen's usage as a safe-haven asset similar to gold. Because of the pair's analogue to the commodity market, it's price action is frequently driven by external pressures that are related in one way or another to the two most popular commodities.
At the present moment, as you most likely are aware, the leading news worldwide is the spread of the coronavirus. The epidemic which began in the Wuhan province in China is now on the verge of becoming a global pandemic, as the proliferation of COVID-19 has recently undergone some structural changes and entered a new stage. While there are indications that the outbreak is losing steam in ground zero and fewer people are getting infected, the number of confirmed cases outside of China is rapidly rising. Just in Italy and South Korea, the number of people diagnosed with the coronavirus has surged past several hundred since last week. All of these changes are going to shift the tone of the virus, as it is being perceived on the global capital markets, and it is, therefore, likely to ramp up the panic that has swept them since the beginning of 2020.
Owing to the fact that the spread of COVID-19 is now taking place much closer to prominent financial hubs in Europe and elsewhere in Asia, the financial markets are likely to be hit with new rounds of adverse volatility in the next several days or weeks (depending on how the situation changes next). Consequently, this is also going to affect the FX markets and likely cause sudden fluctuations in the price actions of prominent pairs, one of which is the CADJPY.
The CADJPY has been trading in an ascending channel since the latter part of 2019, which is when the Canadian economy started to strengthen against the global trade uncertainty at a gradual pace. When the recent global developments are taken into account, however, the tone that underpins the price action of the pair can be altered. Therefore, the purpose of this analysis is to examine whether the underlying direction of the CADJPY is going to change shortly, or the adverse volatility that is expected to stem from the spread of the coronavirus is going to amount to short-term tremors in the price action without distorting the direction of the ascending channel.
1. Long-Term Outlook:
As can be seen on the weekly chart below, the ascending channel is currently contained within the boundaries of two crucial price levels. One is the 61.8 per cent Fibonacci retracement at 84.737, and the other is the 38.2 per cent Fibonacci retracement level at 82.656. Moreover, the price is consolidating just below the 61.8 per cent Fibonacci, which is currently acting as a major resistance level, and the middle line of the regression channel, which outlines the boundaries of the ascending channel itself. This means that the price action is close to beginning establishing a new significant swing in either direction, depending on whether it breaks out above the resistance, or alternatively breaks down below the middle line.
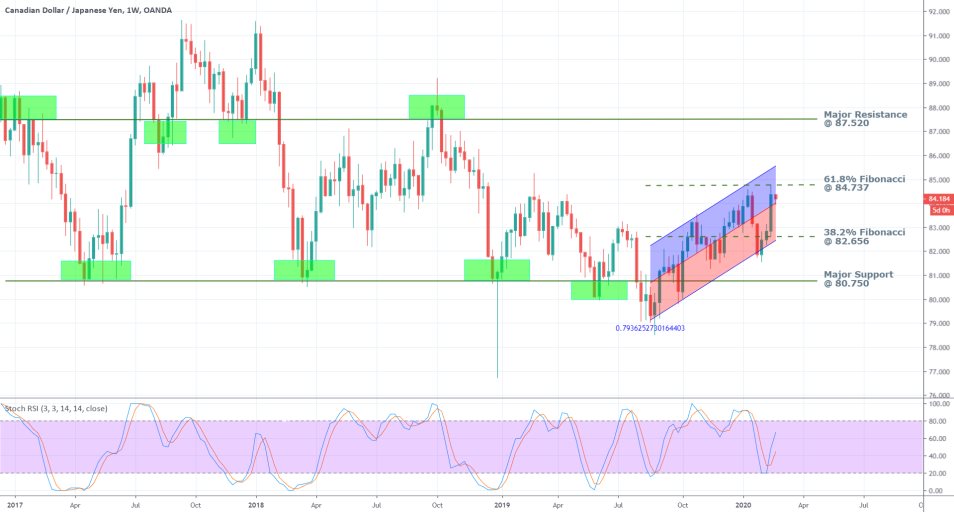
The stochastic RSI (Relative Strength Index) indicates that the rate of execution of long orders has picked up considerably over the last few weeks, which presupposes the continuation of the bullish upswing. In other words, the RSI illustrates the accumulation of bullish orders, and as the demand continues to increase, so the CADJPY is expected to continue rising. On the other hand, the price has already tested the strength of the resistance level at 84.737 once and has subsequently failed to break out above it. This increases the level's importance as a potential turning point, and therefore bears would be betting on another change in the underlying direction of the price action around the 61.8 per cent Fibonacci retracement.
2. The CADJPY and the Fears of a Global COVID-19 Pandemic:
We had previously argued that the Japanese yen is one of those assets that become safe-havens in the markets at times when investors’ general fear is on the rise and concerns over a potential economic recession are abundant. Thereby, the demand for safe-havens such as gold and the JPY is anticipated to surge at times of general market anxiety, which is the case now.
The yen had strengthened during the early stages of the coronavirus’ outbreak in Wuhan when almost nothing was known about the novel virus, and investors weighed in on the likely long-term ramifications for the Chinese economy. That was the case until mid-February when it was announced that the Japanese economy had contracted by 1.6 per cent in the fourth fiscal quarter of 2019, which disrupted the demand for the yen and subsequently caused the currency to plummet.
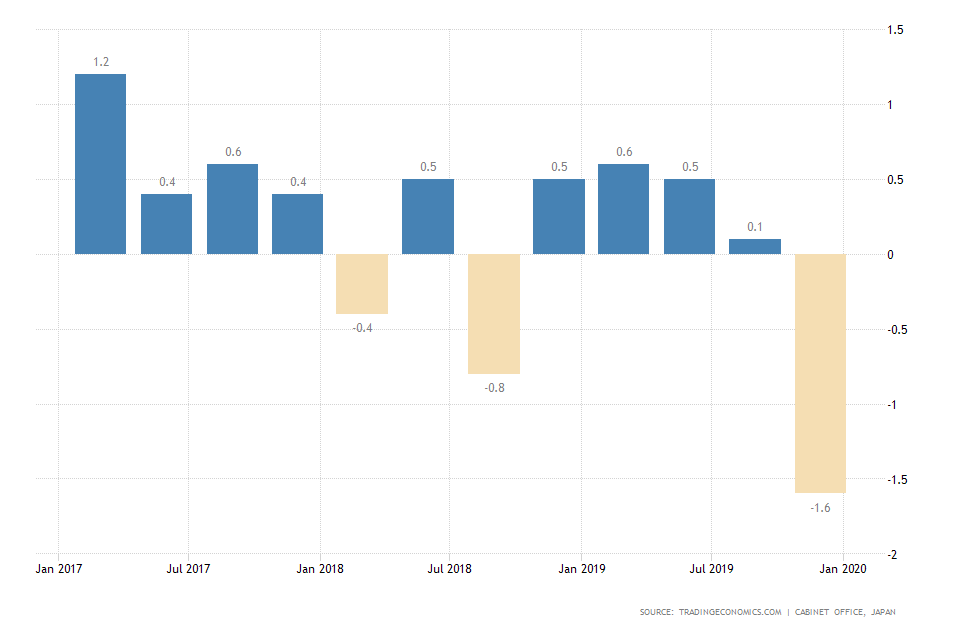
The market had more than a week to absorb these disappointing news and now that the general shock has subsided nothing is standing in the way of the JPY bulls to return to the market.
Now that the rate of new confirmed cases globally exceeds the rate of new cases in China excluding the Wuhan province, the local containment of the coronavirus’ spread seems to be ineffective. Thus, the spread of COVID-19 has entered a new stage of becoming a global issue as opposed to a local one, which raises the fears of a pandemic. Consequently, the market is likely going to react to these recent developments by facing reinvigorated investors' concerns over the resilience of the global economic recovery. It follows that the demand for safe-haven assets is likely to be sparked up once again due to these new structural changes in the spread of the virus, which, in turn, is expected to prompt a new surge in demand for the yen as well.
Overall, the fundamentals are such that the CADJPY is likely to be pressured owing to the mounting external pressures from the spread of the coronavirus so that a bearish correction is likely to take place in the short-term. This does not necessarily mean that the ascending channel on the weekly chart is going to be terminated in favour of the establishment of a new bearish trend, because the long-term demand for the pair remains prevailingly bullish. However, as the situation continues to develop the CADJPY is likely to experience reinstated bearish pressure, which could end up driving the price action lower to form a new dip. This means that the bears would be looking to enter short now and catch the anticipated pullback, whereas the long-term bulls could expect the formation of such a dip in order to enter long at a discount there.
3. Short-Term Outlook:
The increasingly bearish sentiment becomes more pronounced on the daily chart below. Today’s candlestick is a big Marabozu without a shadow and tail, which signifies immense bearish pressure in the market. Such candlesticks are typically found at the beginning of new directional movements in the price action. Moreover, the candlestick is so far breaking below the regression channel's middle line, which confirms the sudden change in the market sentiment towards becoming distinctly bearish.
For the time being, the price action appears to have bounced back from the 61.8 per cent Fibonacci resistance level at 84.737 for the second consecutive time, which looks like the early stages in the establishment of a double top pattern.
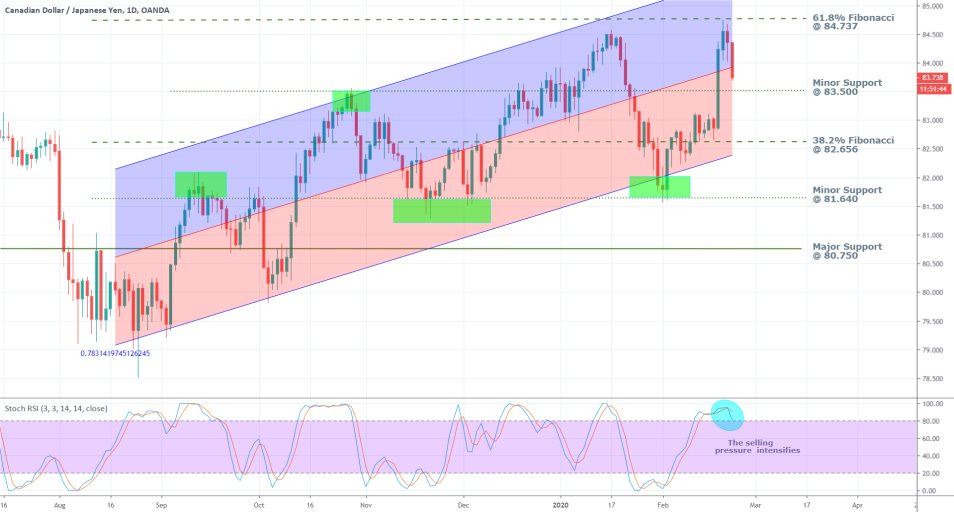
The RSI also confirms the increasingly selling sentiment on the market with the distinctly bearish crossover between the indicator and the stochastic MA. Moreover, this happens in the extreme ‘Overbought’ area, which is likely to prompt more bears to step up and start executing short orders, thereby supporting the rising selling pressure.
There are four likely target-levels for such a bearish downswing, the most immediate one being the minor support level at 83.500 leading up to the major support level at 80.750. Each of the four support levels presented on the chart above is a likely turning point for the direction of the price action and is, therefore, a contender for a dip in the expected price correction.
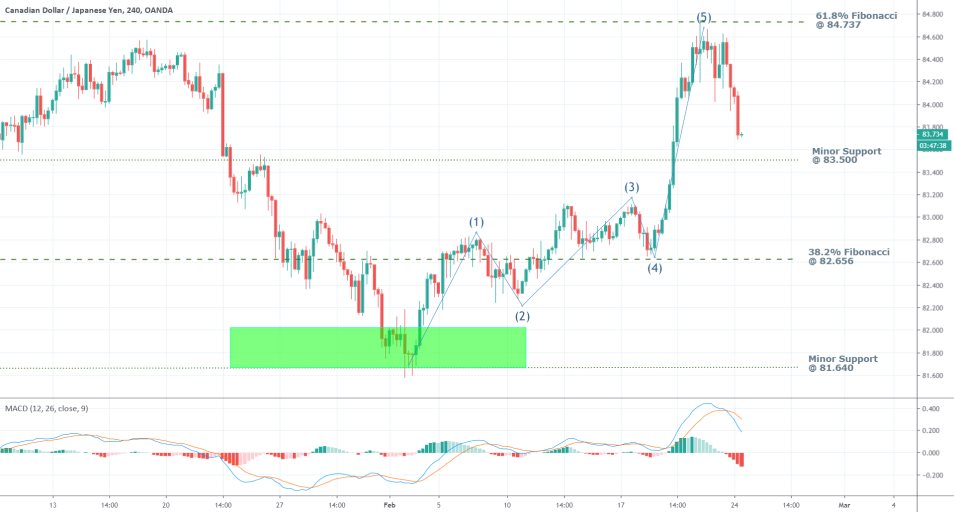
The 4H chart illustrates the rising bearish momentum, as demonstrated by the bearish crossover between the 12-day EMA and the 26-day EMA on the MACD. The short-term momentum is now ostensibly bearish.
The termination of the previous bullish upswing can be further confirmed under Elliott Wave Theory, which postulates that any such movement reaches its peak (dip for downswings) when a 1-5 wave pattern is concluded. This has already happened, which is why the formation of a new bearish downswing now seems to be the most likely result given all of the other evidence.
4. Concluding Remarks:
Trading on the anticipated formation of a bearish correction now seems reasonable, with the likely target-levels being the four supports that were presented above. However, it should be mentioned that even though all of the technical and fundamental indications point to the rising bearish sentiment in the market, it does not necessarily mean that a considerable bearish correction would form. That is so due to the unpredictably of the coronavirus's spread over the foreseeable future. If the direction of the price action reverts itself yet again and breaks out above the resistance level at 84.737, that would be a clear indication that the long-term bullish sentiment has ultimately prevailed.
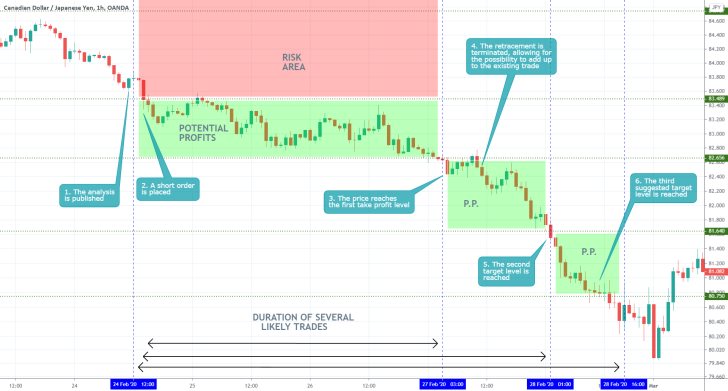
- Not much to be said here, very accurate forecast with excellent execution, successful analysis all around. The preceding entry in the journal emphasised on the need for traders to stay critical of their forecasts. It seems fitting now to underscore the need for traders to be happy and satisfied with themselves when everything goes to plan. The biggest takeaway here is to be satisfied with your performance, so that you can remain active on the market longer – satisfaction from trading helps traders with their fatigue. You should, however, refrain from becoming too content with yourself to the point of departure from reality.
Disclaimer: Your capital is at risk! Trading and investing on the financial markets carries a significant risk of loss. Each material, shown on this website, is provided for educational purposes only. A perfect, 100% accurate method of analysis does not exist. If you make a decision to trade or invest, based on the information from this website, you will be doing it at your own risk. Under no circumstances is Trendsharks responsible for any capital losses or damages you might suffer, while using the company’s products and services. For more information read our Terms & Conditions and Risk Disclaimer.


