1. The EURAUD Pair is Due for a New Major Price Swing
The EURAUD pair has been steadily consolidating within a price range with increasingly narrower boundaries, as indicated by the purple area on the chart below. The price action is currently contained within the Significant Resistance level at 1.63300 and the upwards-sloping trend line at 1.60000 in a ‘bottleneck range’, which may be due for termination. Thus, the price is overdue for a breakout away from the boundaries of the price range.
As can additionally be seen from the chart below, the Relative Strength Index (RSI) is currently verging close to the 50.00 neutral level, which indicates an almost perfect balance between bears and bulls on the market. The apparent momentary equilibrium between buyers and sellers is what currently typifies the aforementioned range. However, as can also be seen, the price action has exhausted almost entirely its capacity for range trading – now the free room left for price fluctuation is around 330 pips. Hence, a new trend is due to emerge once the price breaks outside decisively of the range’s boundaries. So the question is, what is the most likely direction of the forthcoming trend?
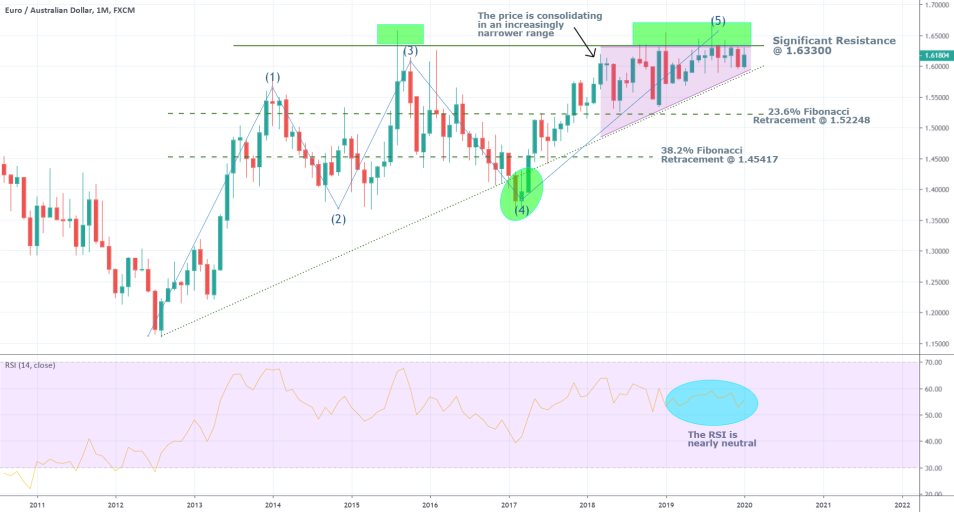
From a strictly technical point of view, a new bearish trend seems like the most obvious assertion. An apparent 1-5 Elliott Wave pattern has formed on the chart, which is typically followed by a corrective ABC pattern in the opposite direction. In this case, an ABC retracement would be headed downwards and away from the top and 5th impulse leg. Additionally, the strength of the significant resistance level has been tested multiple times. However, the price has not been able to successfully break out above it for the time being, which is also evocative of a likely upcoming bearish reversal. There is, however, a chance for the formation of a false breakout ahead of the structure of a new bearish trend, which implies a considerable trading risk.
If the price were to break down below the upwards-sloping trend line, the most obvious target level would be the 23.6 per cent Fibonacci retracement level at 1.52248. Nevertheless, the evidence backing up a likely formation of a new bearish trend from a solely technical standpoint is so far inconclusive. An examination of the current economic and financial conditions in Europe and Australia is needed to back up any further suppositions.
2. Conditions in Europe are Appearing to be Gradually Improving.
- Upbeat Data from Germany – The largest economy in the Eurozone is on the fast track to economic recovery after investors and market analysts last year feared that Germany was at the brink of entering into a new recession. Back then, the German economy narrowly dodged entering into a technical recession when its Gross Domestic Output was recorded at 0.1%, edging higher than the initial forecasts.
On Tuesday this week, it was announced that the German Economic Sentiment Index in January 2020 has jumped to its highest level since July 2015. Currently, at 26.7 points, the index more than doubled its value since December when it was recorded at 10.7. January's performance beat the consensus forecast for 15.2 index points, which confirms the upbeat sentiment among German investors concerning the bright prospects for growth in the new year.
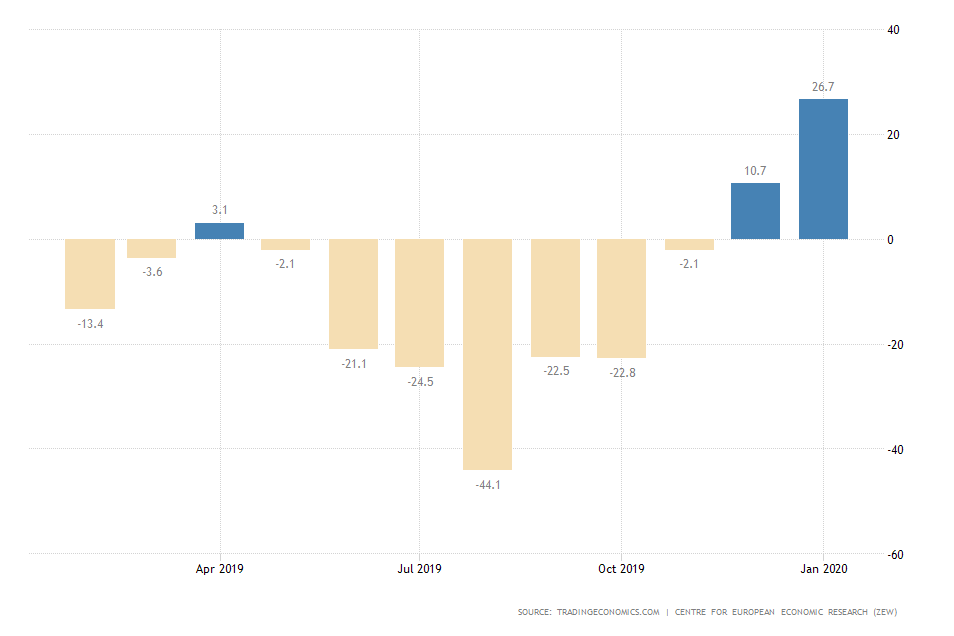
The findings of yesterday’s economic report imply a very likely improvement of the economic situation in Germany in 2020, which undoubtedly is going to have a substantially positive impact on the European economy as a whole. Therefore, an upbeat economic sentiment in Germany is an important prerequisite for growth in the EU, which can be expected to bolster the euro throughout the year at least marginally.
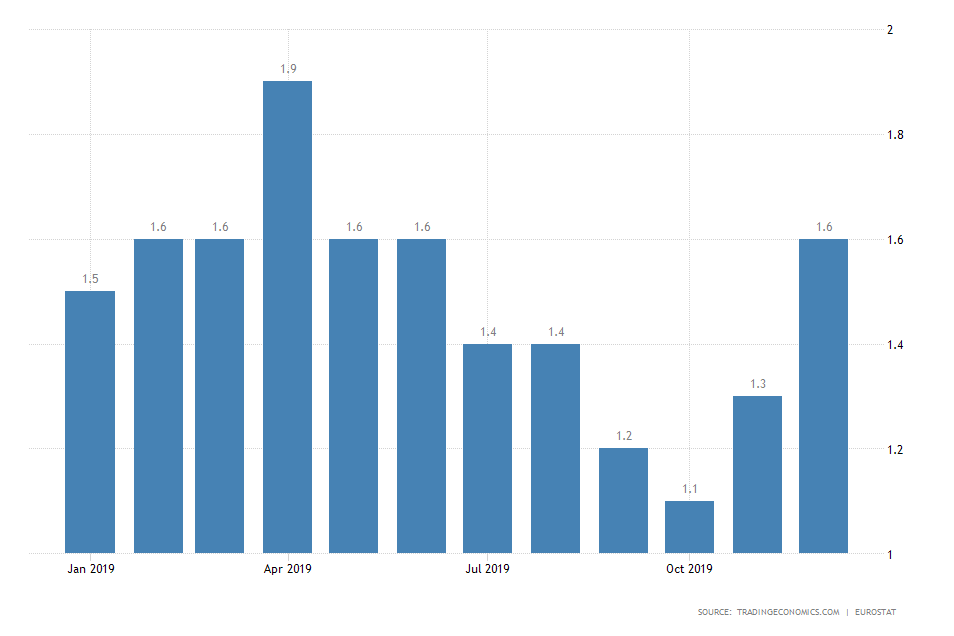
- Room for Optimism in the ECB – The Governing Council of the European Central Bank will be gathering this Wednesday to deliberate on the next appropriate interest rate in the block. The consensus forecasts project no change from the current rate of 0.00 per cent. Nevertheless, there are reasons to expect the Council to implement a more optimistic monetary stance and allude to an increased likelihood of interest rate hikes later in 2020, which would further bolster the euro. One of the most substantial reasons warrantying such optimism is the inflation rate, which is now getting closer to the ECB’s 2 per cent target rate. This is yet another evidence of the improvement of the price stability in the bloc, which, in turn, is yet another prerequisite for future economic growth. Inflation is, however, still below the desirable level, which cannot be overlooked. There is still room for improvement.
- Expectations Run High for Much Needed Improvement in Manufacturing and Services. On Friday crucial economic numbers will be released highlighting the most recent changes in Services PMI and also Manufacturing PMI in France and Germany, and the consensus forecasts project marginal improvements from the last period. If these expectations are met, economic analysts and investors would have more reasons to believe that the European economy is at a positive turning point and is about to start expanding by the end of the first fiscal quarter of this year. Consequently, if the desired outcomes of Friday’s economic reports meet the initial expectations, the euro is more than likely to be boosted. However, if there are disappointments, which is not wholly impossible, the euro is equally as likely to be hit and close this week's session trading lower.
3. The Australian Economy, Too, is Ready to Start Recovering
- The Environmental Woes in Australia Seem to be Nearing an End. For the past couple of months, in Australia, the most pressing topic was the raging bushfires which destroyed hundreds of acres of forestland and killed millions of animals. Environmental threats and crises have been quoted in the past by the Reserve Bank of Australia as key issues which weigh down heavily on the effectiveness of the monetary policy, as they cause distortions in the normal economic processes. Now, however, the situation seems to be de-escalating as the rains have returned to Australia, and the country is ready to recover. The alleviated pressure from the environmental crisis is going to have a positive impact on the economic cycle, which is subsequently going to benefit the Australian dollar.
- The Labour Market is Still Suffering. Employment data in Australia is scheduled for release this Thursday, and market experts project only a marginal jobs growth and no changes in headline unemployment.
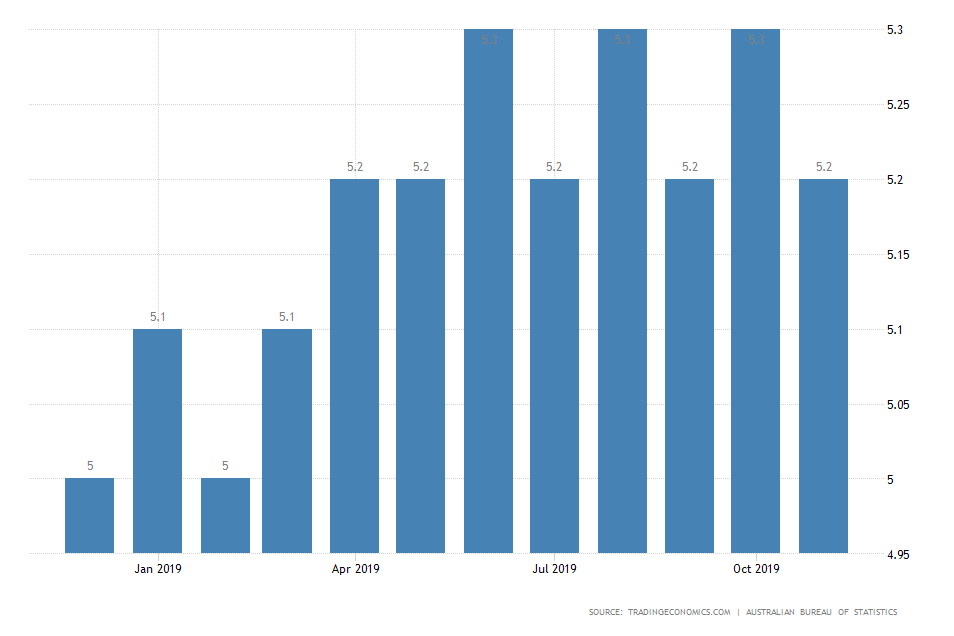
The Australian labour market appears to be currently over satisfied with little inroad for future gains. With such a limited room for potential improvement, the employment data on Thursday is unlikely to have an especially positive impact on the aussie. If the findings of the report, however, miss on those initial forecasts, which would be much more surprising that a reduction of unemployment, the Australian dollar is likely to be hit.
- Favourable International Environment. The biggest thing going on for Australia in the international stage at the current moment is the ongoing revision of international trade, following the signing of Phase One in the negotiations between the US and China. Externally, Australia is very much dependent on an unimpeded global supply network and the free flow of goods and services. Now that the uncertainty factor has been at least partially diminished, the investor confidence in Australia should improve noticeably. Subsequently, the Australian dollar is going to benefit from the expected renewed trade activity.
4. Mixed Messages at Davos.
The world elite is presently gathering in the small Alpine town in Switzerland, and they are discussing major economic and environmental issues that are currently prevailing.
Donald Trump said earlier today that he is interested in signing a new trade deal with the European Union, which would have greatly benefited the euro if he had left it there, given the previous on and off outbursts between him and his European counterparts. Since late 2018, Europe has been on his list and Trump has stated more than once that he is looking to corner the local market and pressure his European allies. Before leaving Davos, however, in a typical way for him, the president threated the EU and attempted to present them with a deadline –the next presidential elections in the US- by which he expects the European economies to have agreed with the terms of his trade proposal.
“They have trade barriers where you can’t trade, they have tariffs all over the place, they make it impossible. They are frankly more difficult to do business with than China.”
These remarks have left investors partially perplexed as to whether the trade tensions between the US and the EU are about to escalate, or whether Trump is ready to compromise in order to establish closer ties with his European partners. Overall, European stocks did not react very noticeably to the news; however, things might change as the situation develops and therefore the euro could really be influenced in either direction in the upcoming days and weeks.
5. How does the EURAUD Pair Look on a Chart with a Smaller Timeframe:
From the above assertions and evidence becomes clear that market pressures on both the euro and the aussie are about to increase in the foreseeable future as the economic situations in the two countries develop. These pressures are going to become especially prevalent once the price manages to break away from the boundaries of the aforementioned range, and the new range is formed.
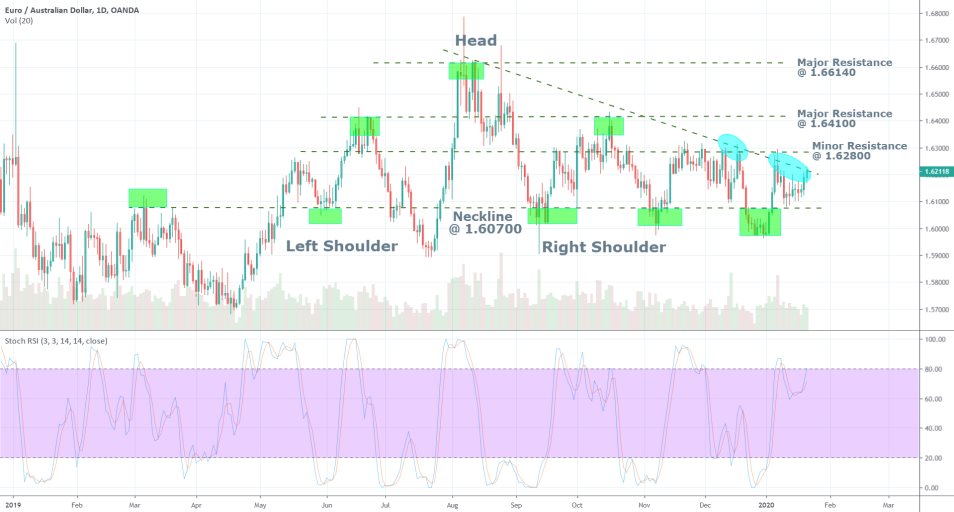
On the daily price chart, it becomes apparent that the pair has been consolidating in an even narrower range in the last couple of weeks than the one presented above. This narrower range can be defined as extending between the support at 1.60700 and the downwards-sloping trend line at the price level of 1.62100.
The Head and Shoulders pattern that is exemplified on the chart, which is typically bearish in nature, has not been able to develop fully and the price has instead consolidated following the termination of the right shoulder. Thus, any trading on the current setup would involve a breakout play – meaning that a proactive trade has to be placed (for eager and less risk-averse traders) at the end of the range in anticipation of the new trend’s formation.
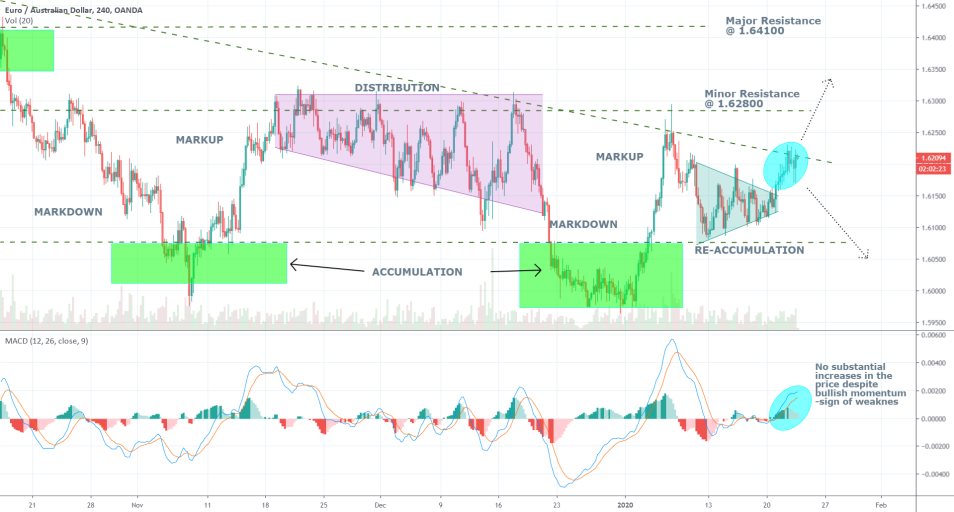
From the 4H chart, the aforementioned 'bottleneck' effect becomes even more apparent. The price is trading in a very tight range and so far fails to break out or break down away from its boundaries. There is still a potential for momentary extension of the range in the next few days to two weeks, but eventually, the trend will develop. It is, however, difficult to project with a high degree of precision in which direction the price will go next. There are indications supporting both possibilities, and it should also be acknowledged that such environments create perfect conditions for adverse price action such as the formation of false breakouts/breakdowns. Thus, trading should be done with caution. The next point will present both bulls and bears with guidelines as to how to position themselves depending on how the market develops next.
6. Trading on the Expectation for a Subsequent Breakout/Breakdown:
Scenario 1 – Executing a long position. Given the overall positive economic news and high hopes in Europe, traders would be looking to enter the market before the formation of a likely bullish trend. Before they do so, however, it would be advisable to wait and see whether the price manages to break out above the next pivotal resistance level. As it was mentioned above, there is a considerable likelihood for the formation of false breakouts and breakdowns, so the trader should not enter the market prematurely.
Entry Level – 10-20 pips above the major resistance level at 1.62800
Stop-loss – Ideally, a floating stop-loss should be placed at least 25 pips away from the initial entry
Scenario 2 – Executing a short position. Given the strength of the significant resistance at 1.63300; the existence of the head and shoulders pattern plus the conflicting evidence from the MACD on the 4H chart, executing a short order would also be justified. If the price corrects itself within the next 2-3 trading days and falls back within the level of the previous re-accumulation stage, the trader might enter short.
Entry level – anywhere below 1.61400
Stop-loss – again a trailing stop-loss at 25pips away would be preferable
Scenario 3 – Executing a Long Straddle. This is an intricate trading strategy (you can find additional information about it in our trading book), which bets on the significance of a forthcoming price swing (trend) as opposed to its direction. Hence, the trader can profit if he positions himself correctly and if the timing is right, regardless of where the price goes next. However, it will not be possible to provide any further guidelines in regards to the execution of a long straddle because its efficiency depends on too many unknown factors, such as the terms and conditions of the reader’s broker and others. Thus, some readers would find this strategy beneficial at the current time while others will not, and that is why its application is strictly subjective.
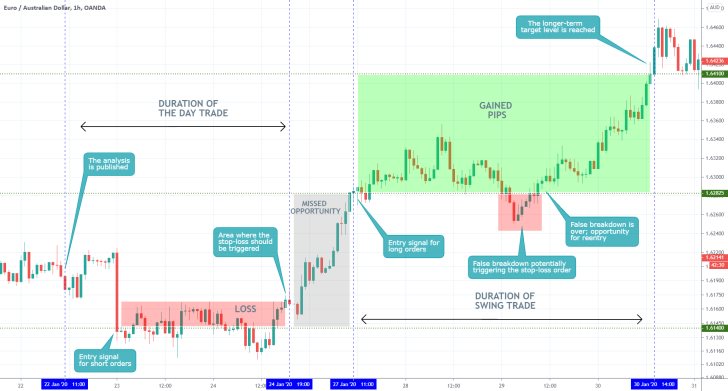
- As regards the suggestion for the implementation of a short-term day trading strategy, the market reached the suggested level around 1.61400 but then consolidated in a tight range around it. The suggested stop-loss was eventually reached on the 24th, leading to a loss of around 30 pips. The trade could have been structured better if an entry level closer to the market price at the time of the analysis' publication had been used instead. It should be remembered that when the market is ranging, one should better use narrow entries, targets, and stop losses.
- As regards the suggestion for the implementation of a longer-term swing trading strategy, few notes should be made. Firstly, the market did indeed reach the suggested target level at 1.64100, which correlates to around 130 gained pips. However, before that, a false breakdown developed, which triggered the initial stop-losses, resulting in a loss of around 25 pips. This underscores the importance of persistency in trading – just because the market hit the stop-loss, it does not necessarily mean that the trading opportunity is spent. Sometimes it is better to enter and exit out of the market several times before one positions himself properly, as opposed to executing one large order in the beginning and hoping the market sentiment does not change afterwards. These issues stemmed from the fact that the initial entry level was too high, underutilising the grey area (missed opportunities).
Disclaimer: Your capital is at risk! Trading and investing on the financial markets carries a significant risk of loss. Each material, shown on this website, is provided for educational purposes only. A perfect, 100% accurate method of analysis does not exist. If you make a decision to trade or invest, based on the information from this website, you will be doing it at your own risk. Under no circumstances is Trendsharks responsible for any capital losses or damages you might suffer, while using the company’s products and services. For more information read our Terms & Conditions and Risk Disclaimer.


