The precious commodity climbed more than $6 per ounce since the height of the market rout in late-March, which was triggered by the coronavirus crisis. The surge in demand for silver was impacted positively by gold's bullish run that was unfolding at the same time. Both developments can be attributed to investors' heightened demand for safe-haven assets, which typically encompass low-risk securities at times of great market volatility and uncertainty.
Even though the general uncertainty stemming from the ongoing pandemic still persists, it encompasses different dimensions and appears to have lessened since the most dramatic times of the economic slump. As a consequence of the diminished uncertainty in the market, the demand for silver, which was previously resulting from the commodity's status as a safe-haven asset, is also depleting.
A bearish correction, or even a new bearish trend, could emerge on silver's price action, which creates some favourable trading opportunities. That is why the purpose of today's analysis is to examine whether or not the recent bullish run is truly exhausted, and if so, how low could the underlying price action go before it finds a new support.
1. Long-Term Outlook:
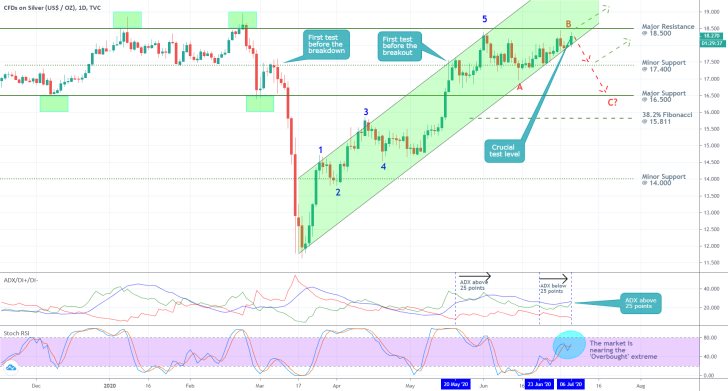
As can be seen on the daily chart below, the price of silver is currently consolidating just below the major resistance level at 18.500. Previously, it had failed to break out above it on three separate occasions, which is the most significant reason as to why a new trend reversal is likely to occur around the resistance yet again.
The latter assertion is further supported by the fact that the price action is currently advancing very close to the ascending channel's lower boundary, which is converging towards the aforementioned resistance level. Such behaviour is illustrative of waning bullish commitment in the market and creates favourable conditions for a trend reversal.
The confluence of signals, all of which suggest a likely trend reversal, is also consistent with the reading we get from utilising the Elliott Wave Theory. As can be seen, the price action has recently finished establishing a bullish 1-5 impulse wave pattern, which was notably terminated just below the major resistance level at 18.500.
The subsequent ABC pattern, which is inherently corrective in nature, reached a swing high at the same level (the peak at point B), which is quite suggestive of the changing market sentiment. A new impulse wave B-C is now likely to drive the price action further south. In order for the corrective ABC pattern to be fully completed, the price of silver would have to dip below the swing low at point A, which assumes the formation of a new dropdown towards the major support level at 16.500.
In case that the currently developing bearish sentiment increases even more than initially thought, the price action could potentially test the strength of the support at the 38.2 per cent Fibonacci retracement level at 15.811. Nevertheless, the strength of the minor support level at 17.400 should not be overlooked, as this level had also shown resilience in the past.
Additionally, market bears should keep in mind that although the underlying bullish commitment in the market is currently running low, it is not completely terminated. The price action could still attempt to break out above the major resistance level at 18.500, which could lead to temporary consolidation above set level.

Meanwhile, the ADX indicator is demonstrating the slow transition of the market environment, from being ostensibly trending to becoming range-trading. The falling value of the ADX is supportive of the primary expectations for a trend reversal.
The Stochastic RSI indicator implies that the market would shortly become 'Overbought', which, in turn, could prompt the execution of more and more selling orders. Consequently, the underlying balance between the buying and selling pressures is probably going to be altered in the forthcoming days.
2. Short-Term Outlook:
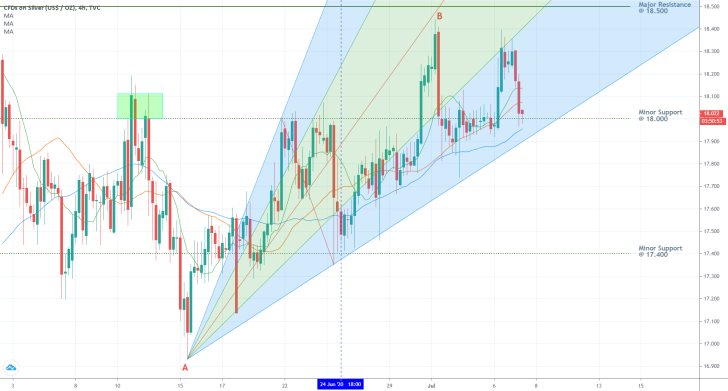
As can be seen on the 4H chart below, the underlying price action is currently testing the strength of the minor support level at 18.00, which has psychological importance due to the three zeroes in the number. Secondly, the pitchfan tool's lower edge is converging towards the same support level, which implies that the price action is likely to fluctuate around the two before a more decisive breakdown is formed.
Thirdly, the price action has managed to break down below the 10-day MA (in green) and the 20-day MA (in orange), however, it remains trading above the 50-day MA (in blue). As a matter of fact, the underlying price action has been trading above the latter since the 24th of June. Before the price action manages to close below the 50-day MA, a rebound further north would remain quite plausible. In other words, the market bears would have a decisive entry single only when the price of silver breaks down below the 50-day MA.

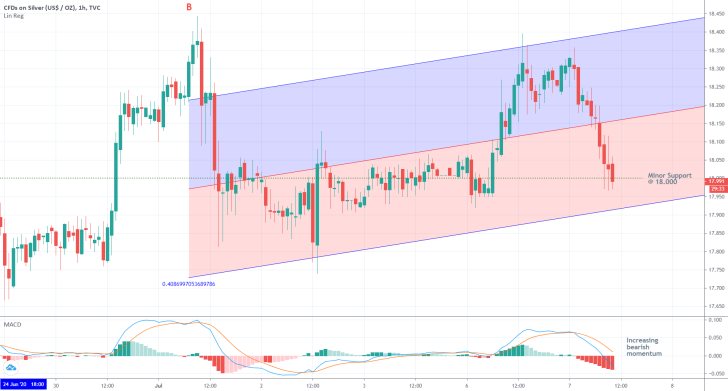
The most recent price action is represented using a regression channel tool, as can be seen on the hourly chart below. In addition to the aforementioned requirements, the price action would also have to break down below the channel's lower boundary before a more sizable dropdown can be anticipated to take place. It is quite possible for the price action to momentarily fluctuate between the latter and the channel's middle line before such a dropdown is finally initiated.
The falling MACD indicator manifests the rising bearish momentum in the market, which favours our primary assertion. However, the bearish crossover between the 12-day EMA and the 26-day EMA happened relatively recently, which means that sporadic fluctuations are indeed likely to take place in the immediate future before a more sizable dropdown emerges afterwards.

3. Concluding Remarks:
The aforementioned fundamental factors are likely to prompt a change in the underlying market sentiment, which would tip the balance in favour of the market bears. The examined technical outlook is also congruent with such expectations because the price action appears to be preparing itself to reverse its direction.
Nevertheless, this process is likely to be accompanied by interim fluctuations and possible bullish retracements. Hence, sellers should be patient and wait for the most optimal places to place their short orders.
The underlying market setup is favourable for the implementation of swing trading strategies.

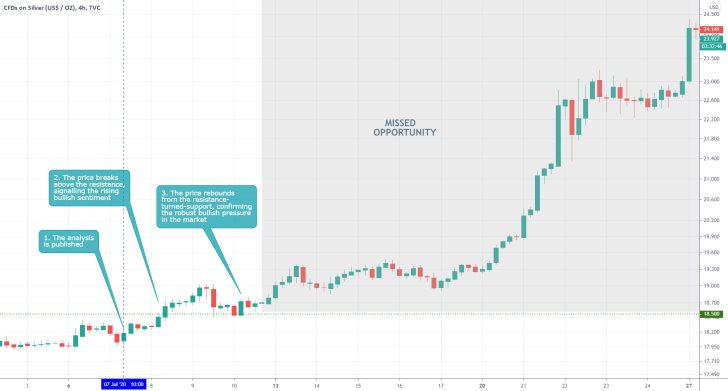
- The analysis completely misconstrued the underlying fundamentals, which is why the trading opportunity was missed. The confusion stemmed from the misunderstanding of the role of silver as a safe-haven asset during the coronavirus crisis. The analysis anticipated the recent bullish trend to be terminated in favour of the emergence of a new bullish trend, which was based solely on preconceived opinions of the behaviour of the price action – an example of cognitive bias.
Disclaimer: Your capital is at risk! Trading and investing on the financial markets carries a significant risk of loss. Each material, shown on this website, is provided for educational purposes only. A perfect, 100% accurate method of analysis does not exist. If you make a decision to trade or invest, based on the information from this website, you will be doing it at your own risk. Under no circumstances is Trendsharks responsible for any capital losses or damages you might suffer, while using the company’s products and services. For more information read our Terms & Conditions and Risk Disclaimer.


