The price of gold behaved exactly as per our projections from our last analysis of the precious commodity's price action. It consolidated in range while having a last-ditch attempt at continuing the bullish run's establishment. The bullish run itself was initiated in the wake of the coronavirus crisis as more and more investors internationally were seeking to hedge their risks from the uncertainties of the pandemic.
Subsequently, the same uncertainty that jolted the markets in early March continued to subside in mid-May. This was happening as governments started easing their containment restrictions, and a general recovery began to take shape as the economic activity was allowed to pick up. With the stabilisation of the economic situation, the previously substantial demand for the precious commodity, which continues to stem from gold's reputation as a safe-haven asset, started to diminish gradually. This is due to the now partially mitigated uncertainty that looms over the prospects for global growth.
In short, the price of gold is likely to remain depreciating for as long as the global economic recovery continues to unfold. Hence, the purpose of today's analysis is to examine this inverse relationship and to discern how low the underlying price action could reach in the foreseeable future.
1. Long-Term Outlook:
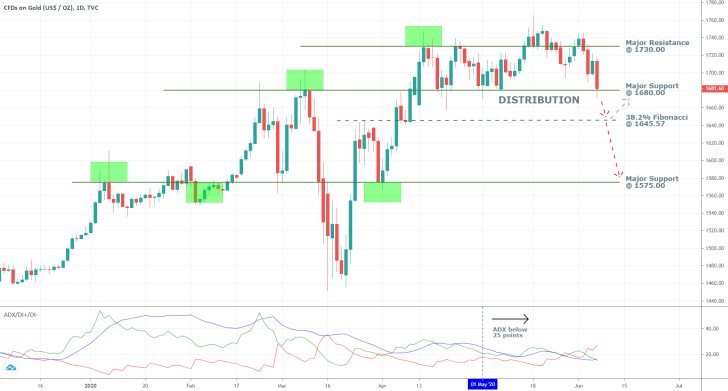
As can be seen on the daily chart below, gold's price action is currently trading within the boundaries of a considerable consolidation range, which is also serving as a Distribution range within the broader context of the Wyckoff cycle. The range's upper edge is represented by the major resistance level at 1730.00, and the major support level at 1680.00 manifests its lower boundary.
The price action is currently testing the strength of the range's lower boundary, which means that the market is preparing to form a significant breakdown, which could lead to the creation of a new substantial Markdown (bearish trend). Such a downtrend, which is anticipated to be indirectly inspired by the monetary policies of the most influential central banks, could underpin the aforementioned recovery process.

The ADX is currently threading below 25 points, which means that the market continues to be range-trading, thereby confirming the Distribution's significance. However, the DI- has been rising over the last several days, which favours the establishment of a breakdown, and a subsequent establishment of a new bearish trending environment.
The first significant target level for such a newly emerging bearish downtrend is going to be encompassed by the 38.2 per cent Fibonacci retracement level at 1645.57. After the price action reaches it, two potential scenarios for future development emerge. The price action could either consolidate within a new marginal range, with the major support level at 1680.00 starting to serve as a resistance and the 38.2 per cent Fibonacci retracement level serving as a lower boundary for the new range.
Conversely, the evolving bearish trend could continue with its further development below the 38.2 per cent Fibonacci retracement level right away, without consolidating first. Thus, the longer-term target level for such a downtrend is going to be encapsulated by the major support level at 1575.00.
2. Short-Term Outlook:
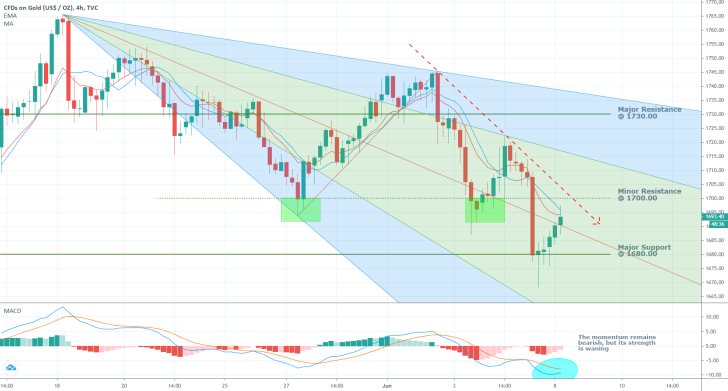
As can be seen on the 4H chart below, the price action is forming a minor bullish correction following the first attempt at a breakdown below the major support level at 1680.00. This opens up opportunities for trend traders and swing traders alike, to join the market at a discount by executing short orders when the correction is exhausted -at the new swing high. Such a minor peak is likely to be reached close to the current market price, seeing as how so many important resistance levels converge around it at present.
First of all, the price action is threading around the middle line of the pitchfan tool, which is serving as an intermediate resistance level (for downswings). Second of all, the 10-day EMA, which is expectedly threading below the 10-day MA, near the price action, which is likely to prompt a new reversal. Third of all, the minor resistance level at 1700.00, which bears significant psychological importance that has already been confirmed on two separate occasions in the short run, presently coincides with the downwards sloping trend line. So, even if the minor bullish correction manages to break out above the pitchfan's middle line and the two Moving Averages, a peak is expected to form somewhere around the 1700.00 mark.

The underlying momentum remains ostensibly bearish, which favours the establishment of a new major breakdown. However, it is also waning, which, in turn, underlines the current bullish correction.
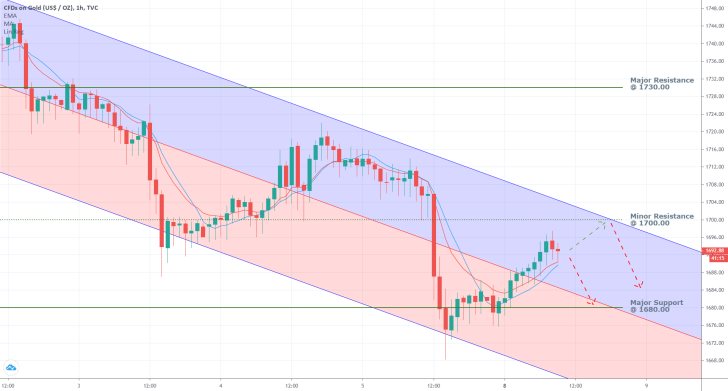
As can be seen on the hourly chart below, the price action has been examined through the lenses of a downwards sloping channel. This explains why the first attempt at forming a breakdown below the major support level at 1680.00 was a failed one, seeing as how the price action rebounded from the channel's lower boundary.
The 10-day EMA has crossed above the 10-day MA in the very short-term, which underscores the establishment of the current bullish correction. The latter is likely to reach the aforementioned minor resistance level at 1700.00, which coincides with the upper boundary of the downwards sloping channel, before a new reversal in the underlying direction of the price action occurs.
In other words, the hourly chart below confirms the previous assertions regarding the possible termination point for the currently developing bullish correction, which is where a new swing high is likely to form. Afterwards, the broader markdown can continue with its own establishment.

3. Concluding Remarks:
Overall, the underlying fundamental factors favour the establishment of a new significant Markdown. Before this happens, however, a minor bullish correction has to be concluded first. This, in turn, creates good opportunities for swing trading as well as for trading on a newly developing trend.

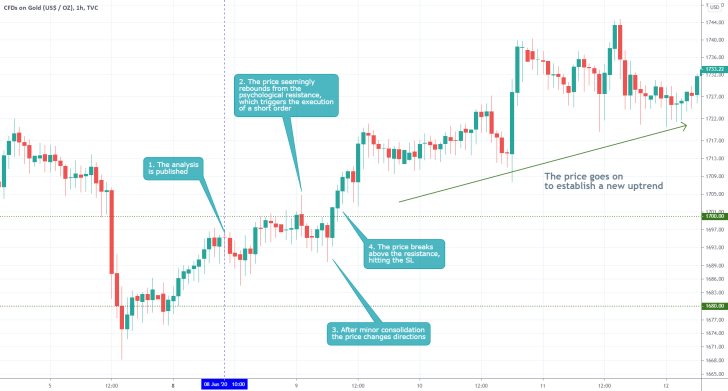
- The analysis completely misread the underlying fundamentals. Everybody is prone to making the occasional sweeping mistakes, which is normal. Traders should not take such occasions to heart, instead they should use the opportunity to perhaps take a small break from trading, and to rethink their approach to trading.
Disclaimer: Your capital is at risk! Trading and investing on the financial markets carries a significant risk of loss. Each material, shown on this website, is provided for educational purposes only. A perfect, 100% accurate method of analysis does not exist. If you make a decision to trade or invest, based on the information from this website, you will be doing it at your own risk. Under no circumstances is Trendsharks responsible for any capital losses or damages you might suffer, while using the company’s products and services. For more information read our Terms & Conditions and Risk Disclaimer.


