Bearish pressure continues to weigh down heavily on the energy market. Still, the behaviour of crude oil's price action in the short term is demonstrating early signs of a probable bullish pullback currently in the making.
The monetary policy minutes from BOE's August meeting underscored the expectations of the Policy Committee (MPC) for stable recovery over the next several months, despite the fallout from the delta variant of coronavirus. In light of these forecasts for robust economic activity in the medium term, the demand for crude oil is also likely to remain stable enough to sustain such a bullish pullback.
These bullish pressures are likely to be bolstered tomorrow following the publication of the July non-farm payrolls in the U.S. The consensus forecasts point to a very probable pick-up in employment, which would complement these forecasts for solid demand.
Hence, bulls have an opportunity to implement contrarian trading strategies in the short term. In contrast, bears might have to wait for the completion of the pullback before they use trend-continuation strategies to trade on a likely subsequent reversal.
The gradual development of the trend reversal
As can be seen on the daily chart below, the aforementioned bearish reversal was underpinned by the breakdown below the ascending channel. Following the initial breakdown, the price action rebounded from the 100-day MA (n blue) and the psychologically significant resistance-turned-support level at 66.30.
It is worth pointing out that the subsequent throwback was exhausted just below the channel's lower boundary. This signifies the new prevalence of selling pressure in the market. Moreover, the peak of the throwback underpins the emergence of a new descending trend line (in black).
Seeing as how the price action has already reversed from it on three several occasions, this descending trend line is likely to serve a central role in the future development of the new downtrend.
Any future bullish pullback is likely to reverse from it, thereby creating more opportunities for bears to use trend continuation strategies - selling at the peak of a pullback in anticipation of further price depreciation.
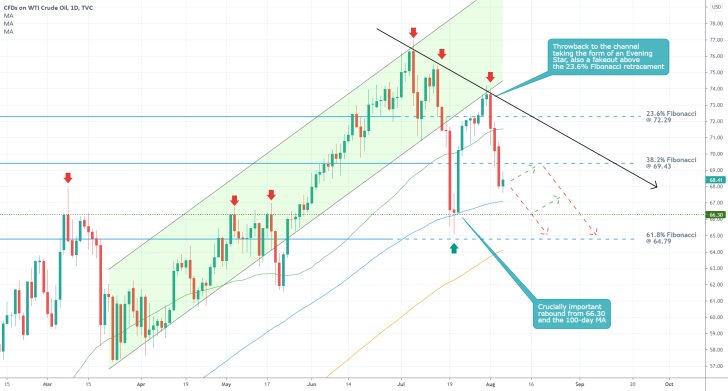
Presently, the price action is consolidating below the 38.2 per cent Fibonacci retracement level at 69.43. Its close proximity to the psychologically significant threshold at 70.00 makes the latter an even more important turning point for the price action.
While a minor pullback to 69.43 from below is not entirely unconceivable, the next major target for the downtrend is the 61.8 per cent Fibonacci retracement level at 64.79. That is, if the price manages to break down below the resistance-turned-support at 66.30 decisively.
The territory between the 100-day MA and 66.30 represents a major support area, which is something that bears need to take into careful consideration. This is where future bullish rebounds are most likely to occur.
It should also be pointed out that the 150-day MA (in orange) is about to converge with the 61.8 per cent Fibonacci retracement, making the latter an even more significant threshold.
The emergence of a minor consolidation range in the short term
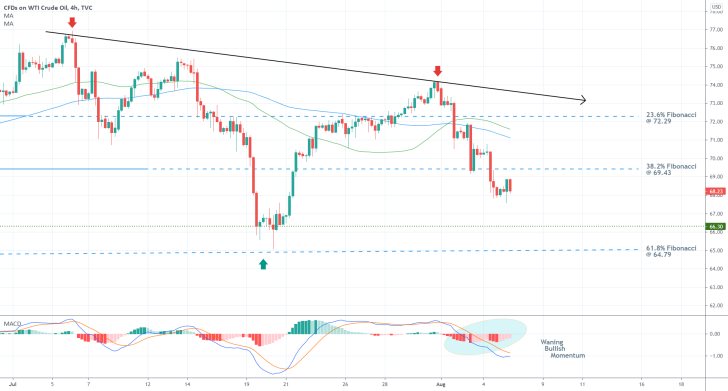
At present, the latest downswing appears to be in the middle stage of its development. This is underpinned by the MACD indicator (correction: the indicator demonstrates waning bearish momentum, not bullish momentum).
The histogram is drawing near the 0.00 mark, even though the 12-day EMA (blue) continues to be threading below the 26-day EMA (orange). Overall, this should be taken as a very early indication that the underlying bearish momentum is waning, which should not be misconstrued for a buy signal.
Even still, it is worth pointing this out, given the emergence of a Hammer (the previous candle). These mixed signals are to be expected in the middle portion of an existing upswing/downswing, which is why traders should not rush to join it at the present moment. This concerns bears. Bulls, in contrast, could still weigh in on the likelihood of a minor pullback.
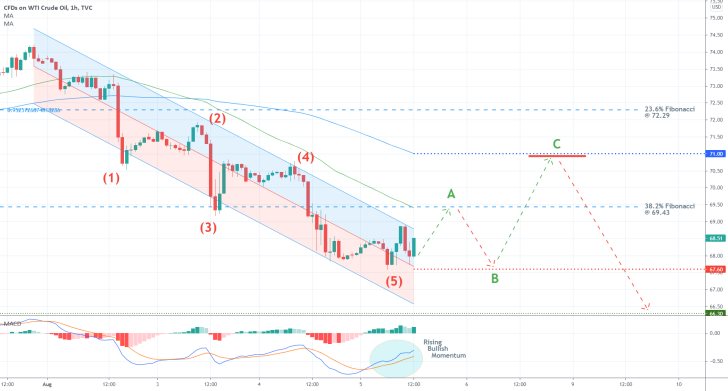
The latest downswing appears to be taking the form of a bearish 1-5 impulse wave pattern (in red), as postulated by the Elliott Wave Theory. This can be seen on the hourly chart below. Additionally, the downswing is represented as a descending regression channel.
This time, the current reading of the MACD indicator implies that the downswing has already likely bottomed out. Hence, it could likely be time for the emergence of a minor bullish pullback in the form of an ABC correction. This is the aforementioned opportunity that bulls can take advantage of in the short term.
Concluding Remarks
Bulls can look for an opportunity to go long around the current spot price, placing a stop-loss order just below the minor support level at 67.60. The middle line of the channel underpins the latter.
As stated earlier, the first target for such a pullback is represented by the 38.2 per cent Fibonacci retracement level at 69.43. Notice that the latter is currently being crossed by the 50-day MA (in green). The next target is the minor resistance level at 71.00, which is flagged by the 100-day MA.
Bulls should keep in mind that contrarian trading entails a high degree of risk, which is why this setup is not suitable for risk-averse traders.
Bears, in contrast, would make a mistake if they enter the market now, this late into the development of the established downtrend. Instead, they would better wait until the price climbs to the 38.2 per cent Fibonacci/the minor resistance at 71.00 before they seek to sell at the resulting swing peak.
They can do so on the expectations for another reversal once the pullback is completed.
Time for Another Reversal on the Price of Crude Oil
Crude oil bears have been waiting patiently for another chance to sell the commodity, potentially adding up to their selling orders, and the time for doing so might finally be here. The latest pullback, which was initiated a couple of days ago, has reached a major resistance level, which stands a good chance of causing another reversal.
The highly anticipated U.S. inflation data for July bolstered the pullback by driving the price of crude higher by nearly 3.0 per cent during yesterday's trading session. Consumer prices eased for the first time since the beginning of the year, which reassured producers momentarily.
The price of the commodity thus jumped on the expectations for persisting energy demand in the near future. However, the market would soon price in yesterday's report and this enthusiasm would then probably subside. Consequently, WTI's pullback would then likely run out of steam, giving credence to the expectations for another reversal.
The underlying setup is thus suitable for the implementation of trend continuation trading strategies by bears looking to sell at the top of the pullback in anticipation of continued price depreciation.
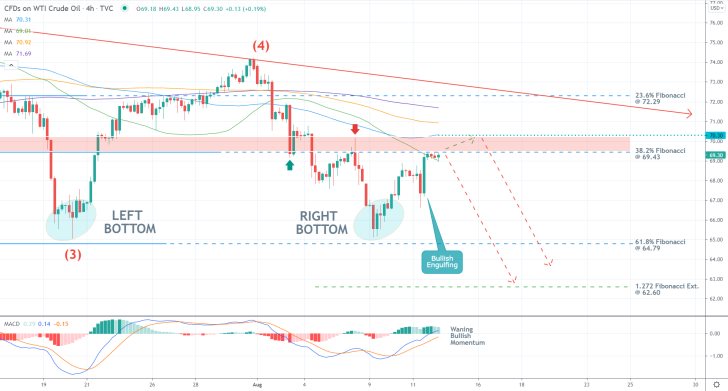
As was pointed out in the original analysis, the price of crude oil appears to be developing a massive bearish 1-5 impulse wave pattern (in red), as postulated by the Elliott Wave Theory.
Following the completion of the 3-4 retracement leg, which happened after the price reversed from the descending trend line (in red), the price action carried on establishing the final 4-5 impulse leg. And the current pullback represents a minor component of that broader impulse leg, similarly to what is currently being observed on the price action of the GBPUSD pair.
As stated above, yesterday's inflation numbers catalysed another uptick, which takes the form of the Bullish Engulfing. Afterwards, the price action went on to consolidate just below the 38.2 per cent Fibonacci retracement level at 69.43.
The latter represents the lower end of a strong resistance area (in red), whose upper limit is underpinned by the psychologically significant resistance level at 70.00. Additionally, the 100-day MA at 70.30 can also be perceived as an important turning point for the resistance area.
Bears can look for a chance to sell around the current spot price, though they should be mindful of potential adverse fluctuations above the 23.6 per cent Fibonacci. That is why they should not place their stop-loss orders above the 100-day MA. If the price action manages to break down below the 61.8 per cent Fibonacci at 64.79, the next bearish target would be the 1.272 Fibonacci extension at 62.60.
On the one hand, the waning bullish momentum, as underpinned by the MACD indicator, and the perfect descending order of the four moving averages - the 50-day MA (in green) threading below the 100-day MA, threading below the 150-day MA (in orange), threading below the 200-day MA (in purple) - highlights the strong bearish sentiment in the market.
On the other, a potential Double Bottom may be developing at present, which bears should keep an eye on. If the price action establishes a decisive breakout above the resistance area in red, this could signify the beginning of a new bullish uptrend.
Is Crude Oil Set for a Pullback?
The price of crude oil has expectedly depreciated by more than $2 per barrel recently, as was forecasted in our previous follow-up analysis of the commodity. The drop is owing to a transformative change in the underlying demand pressures for goods and services.
The global economic recovery is entering into a new stage - that of heightened demand for services instead of goods. This process is expected to be underpinned by the retail sales numbers in the U.S. and UK that are scheduled for publication this week.
This means that the prevailingly bearish sentiment in the energy market is likely here to stay in the medium term. However, the situation is not so clear-cut in the short term. The price of crude oil may be due for another bullish pullback given the robust economic numbers that have been pouring in as of late.
This means that both bulls and bears have something to look forward to, depending on their preferred timescale. As regards the current trading outlook in the short term, bulls can utilise high-risk contrarian strategies to trade on the expectations for another bullish pullback if certain conditions are first met.
Bulls should keep in mind that they would be trading against the established trend, which means that they need to apply an extra dose of caution.
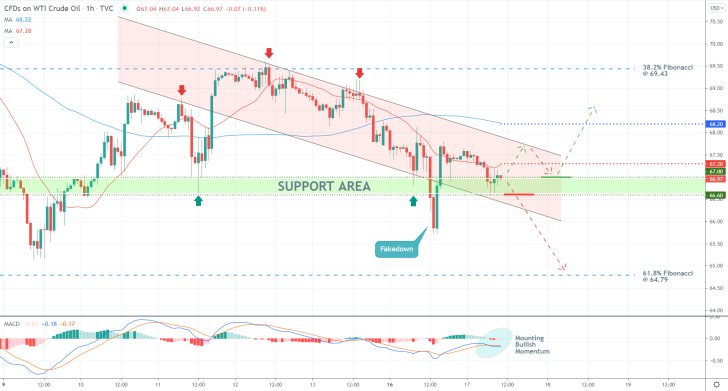
As can be seen on the hourly chart above, the price action remains concentrated within the boundaries of a descending channel, which implies persisting bearish pressure. However, it is also threading above the major Support Area (in green), where the aforementioned pullback is likely to emerge.
The support area stretches between the major support level at 66.60 and the major resistance at 67.00. The price action is currently testing its strength as the underlying momentum becomes increasingly more bullish-oriented. The MACD indicator underscores this.
Bulls can look for an opportunity to go long only on the condition that the price action continues to strengthen above 67.00. Preferably, they can do so once the price action breaks out above the 20-day MA (in red) decisively. The moving average is currently positioned at 67.30.
More risk-averse bulls can be even more patient, looking to buy crude oil when a throwback to the 67.00 resistance-turned-support is established from above.
Their target level is represented by the 38.2 per cent Fibonacci retracement level at 69.43. However, once the price action breaks out above 68.20 (the 100-day MA in blue), they can substitute their fixed stop orders for floating TPs in order to protect themselves against sudden fluctuations.
Bulls can look at the major support level at 66.60 as a benchmark for their stop-loss orders. They should not be positioned far away from the lower boundary of the Support Area.
Bears, in contrast, can consider entering short on the condition that the price action manages to break down below 66.60 decisively, placing a SL just above the 20-day MA. Their next target is underpinned by the 61.8 per cent Fibonacci retracement level at 64.79.
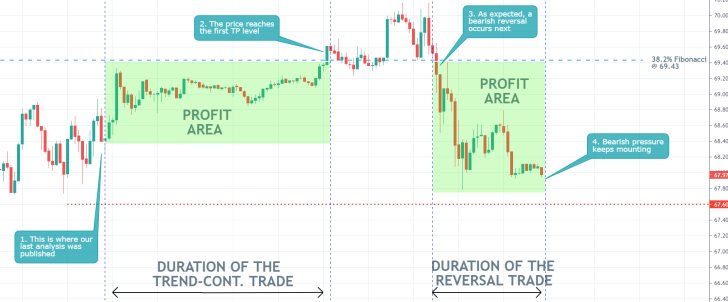
- Our last crude oil analysis is probably one of our most successful forecasts in terms of projecting the likely behaviour of the underlying price action.
- It was instrumental in forecasting the continuation of the upswing towards the 38.2 per cent Fibonacci retracement level at 69.43, followed by a bearish reversal just below the psychologically significant resistance level at 70.00.
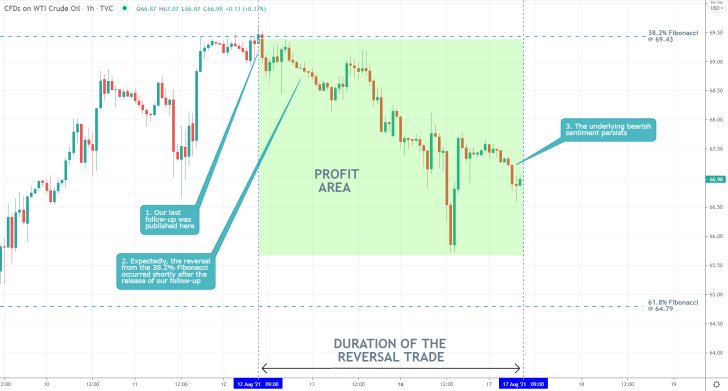
- Our last follow-up analysis of crude oil was massively successful. It accurately forecasted a reversal from the 38.2 per cent Fibonacci retracement level at 69.43 (just below the psychologically significant resistance level at 70.00) shortly after its publication.
- For the time being, the substantial bearish bias in the market persists. The price action is likely to continue depreciating towards the 61.8 per cent Fibonacci retracement at 64.79 in the near future.
- This is a good example of why timing your trades (both entries and exits) is so vitally important in trading.
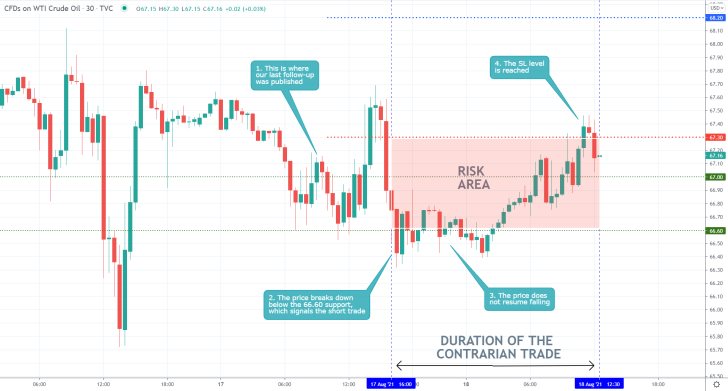
- Our last follow-up analysis of crude oil incurred a moderate loss after the price action established a false breakdown below the 66.06 support level.
- This prompted the execution of a selling order, which was then promptly terminated after the SL order was triggered at 67.30 on the subsequent rebound.
- No trader can have only winners, which is why such losses should not cause too much frustration and anxiety.
Disclaimer: Your capital is at risk! Trading and investing on the financial markets carries a significant risk of loss. Each material, shown on this website, is provided for educational purposes only. A perfect, 100% accurate method of analysis does not exist. If you make a decision to trade or invest, based on the information from this website, you will be doing it at your own risk. Under no circumstances is Trendsharks responsible for any capital losses or damages you might suffer, while using the company’s products and services. For more information read our Terms & Conditions and Risk Disclaimer.


