Recently, the NZDJPY pair attempted to break down below a massive range, which has been prevalent for the most part since early-June. The attempt amounted to nothing more than a false breakdown, as the price action quickly rebounded yesterday. The pair is now ready to re-enter the area of the range once again.
Such erratic fluctuations are not uncommon for range-trading environments, which can be exploited by traders. If the price action manages to break out above the range's lower boundary, which is presently serving the role of temporary resistance, this would mean that it would be ready to advance higher towards the range's upper boundary.
The purpose of today's analysis is to examine the evolving setup and to outline the most important levels of support and resistance for the future development of the NZDJPY pair.
1. Long-Term Outlook:
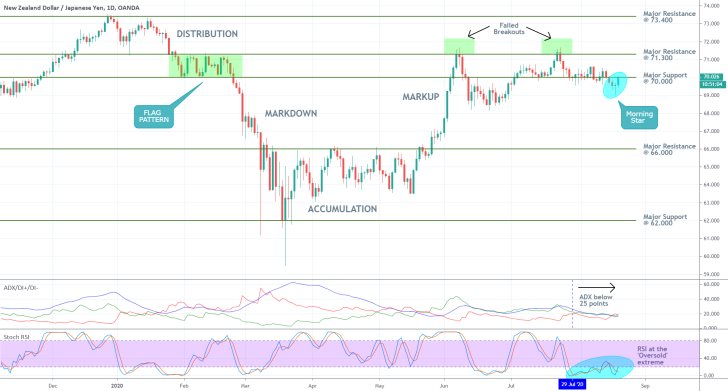
There are, in fact, two crucially important ranges to be considered. Firstly, there is the Distribution, which spans between the major resistance level at 73.400 and the major resistance level at 71.300. The significance of the Distribution is confirmed by the two failed attempts of the price action at forming a break out above the range's lower edge (sketched on the daily chart below). This means that the next target-level for NZDJPY's rally is encapsulated by the resistance at 71.300.
The latter also serves the role of an upper boundary for the second range of interest, which has the major support level at 70.000 as its lower edge. This particular support level has significant psychological importance, which is why it is unsurprising to see erratic fluctuations around it. It would, however, take a considerably higher degree of commitment in the market for the price action to break down below this psychological barrier decidedly; a commitment that for the time being is lacking.
Therefore, the formation of a morning star pattern, which typically entails rising bullish sentiment, just below the psychological support at 70.00 is not surprising at all. The snap rebound can also be perceived as a 'Spring' formation within the broader Wyckoff cycle, which is congruent with the primary expectations for the continued appreciation of the price action.
There is a confluence of the underlying pieces of evidence signalling a likely hike of the NZDJPY pair towards the major resistance level at 71.300.

The ADX indicator resumed threading below the 25-point benchmark on the 29th of July, which means that the market is currently ostensibly ranging. This, in turn, diminished the likelihood for the formation of a new downtrend. Instead, it raises the prospects for a snap rebound towards the aforementioned resistance.
Additionally, the Stochastic RSI indicator has been threading in its 'Oversold' extreme roughly since the markets started range-trading. This illustrates the inability of the underlying selling pressure to drive the price lower, below the recent dip. Accordingly, traders are likely to recognise the ranging sentiment coupled with the oversold market, both of which factors could prompt them to start placing long orders on the anticipation for a subsequent reversal.
2. Short-Term Outlook:
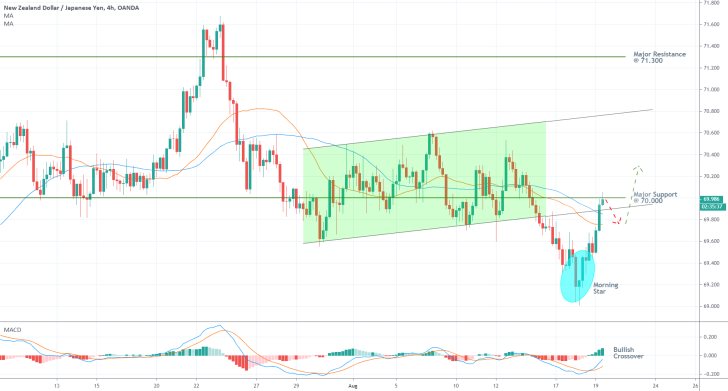
As can be seen on the 4H chart below, the price action currently finds itself at a critical junction point due to the convergence of multiple important levels. On the one hand, it managed to break out above the ascending channel's lower edge, which is demonstrative of a rising bullish bias.
On the other hand, the pair continues to be trading below the 70.00 level, which is presently serving the role of a temporary resistance. The continued consolidation of the pair below set resistance is demonstrative of the persisting downwards pressure, which could yet jeopardise the future hike of the pair.
As a whole, there are more bullish signals at present than there are bearish ones. The fact that there is another morning star pattern on this chart with smaller timescale is once again exhibitive of mounting bullish bias. Moreover, the price action managed to break out above the 30-day MA (in red) and the 50-day MA (in blue). The underlying bullish signal would be even more decisive if the former manages to cross above the latter, while the price action remains concentrated above the two.
Finally, the MACD indicator has recently established a bullish crossover, which is also congruent with the primary expectations for the continued appreciation of the price action further north.

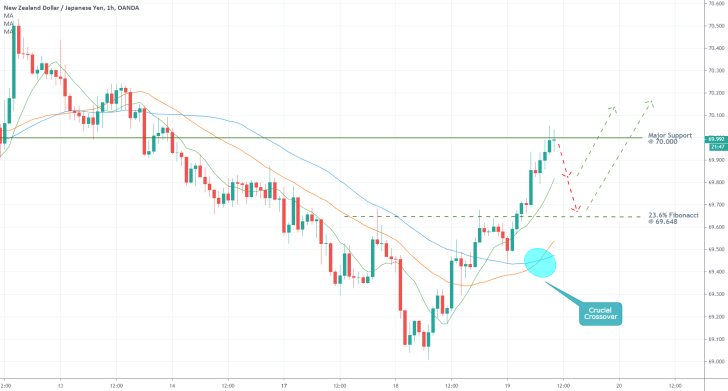
Further confirmations of rising bullish sentiment can be seen on the hourly chart below. The 30-day MA has already shot above the 50-day MA, which represents a crucial crossover and a major steppingstone for the continued appreciation of the price action. Accordingly, the 10-day MA (in green) is already trading above the other two moving averages, with the price action being concentrated above the three. This ascending order of the four is demonstrative of robust buying pressure in the market.
The market has evidently started developing a new upswing, which is still susceptible to forming minor retracements. The 70.00 level represents a likely turning point for the price action, which can now retrace to either of the three moving averages currently serving as floating supports before the hike can be continued further north and past the 70.00 resistance.
The 23.6 per cent Fibonacci retracement level at 69.648 is also close to the current market price, which makes it another prominent support. At any rate, the price action is not expected to drop below this Fibonacci support before it resumes advancing north.

3. Concluding Remarks:
The currently evolving market setup offers traders the opportunity to take advantage of it in two different ways. Less risk-averse contrarian traders could exploit the likely development of a minor bearish retracement from the 70.00 level in the immediate future. In comparison, longer-term traders could wait for the market to establish such a minor correction so that they can then enter long on the expectations for the development of a hike towards the Distribution range's lower boundary.

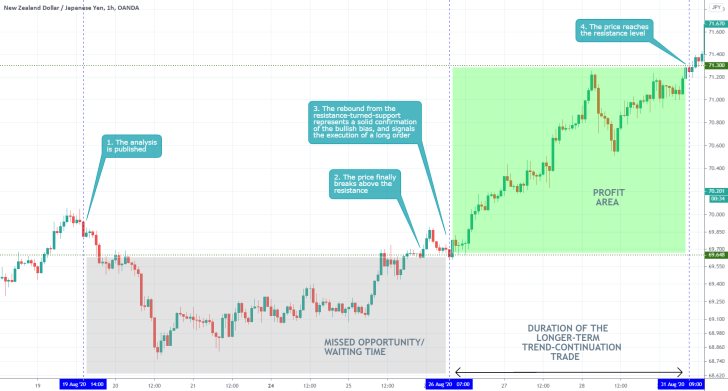
- The analysis had very good short-term and longer-term projections. The price did indeed establish a bearish correction shortly after the publication of the analysis, followed by a broader uptrend afterwards. However, the actual size of the correction exceeded the expectations of the analysis.
Disclaimer: Your capital is at risk! Trading and investing on the financial markets carries a significant risk of loss. Each material, shown on this website, is provided for educational purposes only. A perfect, 100% accurate method of analysis does not exist. If you make a decision to trade or invest, based on the information from this website, you will be doing it at your own risk. Under no circumstances is Trendsharks responsible for any capital losses or damages you might suffer, while using the company’s products and services. For more information read our Terms & Conditions and Risk Disclaimer.


