Investors' fears concerning the new coronavirus variant spur a selloff on higher-risk assets, including Bitcoin and Ethereum. The bearish reversal on ETHUSD is further bolstered by mounting geopolitical tensions and rising inflation concerns. Therefore, the current setup is suitable for the implementation of contrarian trading strategies by bears.
The rapidly changing market sentiment is additionally underpinned by the recent uptick in selling pressure on the otherwise trending dollar. In many ways, the crypto selloff runs parallel to the greenback depreciation, while demand for lower-risk securities is on the rise.
Bears can therefore look for an opportunity to sell the still peaking ETHUSD, though they should remain cautious of potential adverse fluctuations. The expectations of another robust non-farm payrolls report on Friday could represent a temporary respite for the struggling dollar, which could also help the ETHUSD in the short term. That is why bears might have to execute several selling orders before they gain a favourable entry.
Probing the Major Resistance-Turned-Support Area:
The new downtrend commenced following a dropdown to the 23.6 per cent Fibonacci retracement level at 4122.94, as shown on the daily chart below. It underpins a major resistance-turned-support area (currently in green), which represents the most significant test for the new downtrend. A decisive breakdown below it would confirm the new downtrend.
Notice that the initial dropdown was followed by a pullback to the 20-day MA (in red), which is a type of behaviour that is to be expected as the price action changes directions. The recent bearish engulfing candle then broke down below the 23.6 per cent Fibonacci and the 50-day MA (in green), representing the major resistance level at 4230.00. Hence, the temporary consolidation of the price action just below 4122.94 likely signifies the preparation for further dropdowns in the near future.
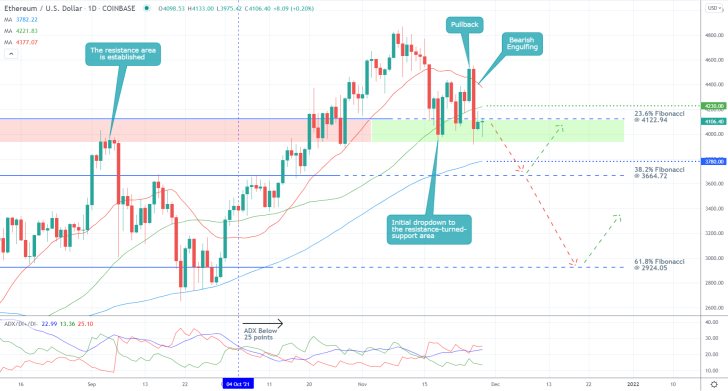
The ADX indicator has been threading below the 25-point benchmark since the 4th of October, underlining the weak bullish commitment in the market. This reading is indeed congruent with the expectations for a decisive bearish reversal in the near future.
The next bearish target unsurprisingly will be the 38.2 per cent Fibonacci at 3664.72, though bears should be mindful of possible rebounds from the 100-day MA (in blue). The floating support currently signifies the potential turning point at 3780.00.
The Likely Beginning of a New Elliott Cycle
The reversal commenced following a breakdown below a major Bearish Pennant, as can be seen on the 4H chart below. More importantly, the new downtrend appears to be taking the form of a 1-5 impulse wave pattern, as postulated by the Elliott Wave Theory.
The aforementioned pullback from the 23.6 per cent Fibonacci can thus be seen as the first retracement leg (1-2) of the new pattern. Consequently, it can be assumed that at present, the price action is busy developing the second impulse leg (2-3) towards the 38.2 per cent Fibonacci.
Due to the fractal nature of the price action, this impulse leg itself is also likely to be structured as a 1-5 impulse wave pattern. Hence, the minor (C-1) drop to the 400-day MA (in purple) was then followed by a minor retracement (1-2) to the 23.6 per cent Fibonacci.
From this, we can ascertain that the second minor impulse (2-3) leg would likely bottom out around the aforementioned 3780.00 support, just below the 500-day MA (in black). From this, a (3-4) retracement leg is likely to ensue to the 400-day MA from below. Finally, the last minor impulse (4-5) would probably reach the first major target (the 38.2 per cent Fibonacci), from which the broader (3-4) retracement leg is likely to emerge.
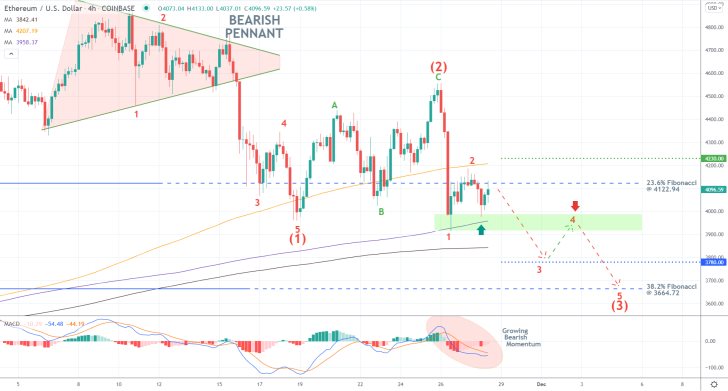
For the time being, it is important to point out two additional things. Firstly, the 300-day MA (in orange) converges with the 4230.00 resistance, making it an even more prominent threshold. Any adverse fluctuations are therefore likely to be held back by it. Secondly, the MACD indicator is currently demonstrating rising bearish momentum, which confirms the expectations for additional price depreciation in the foreseeable future.
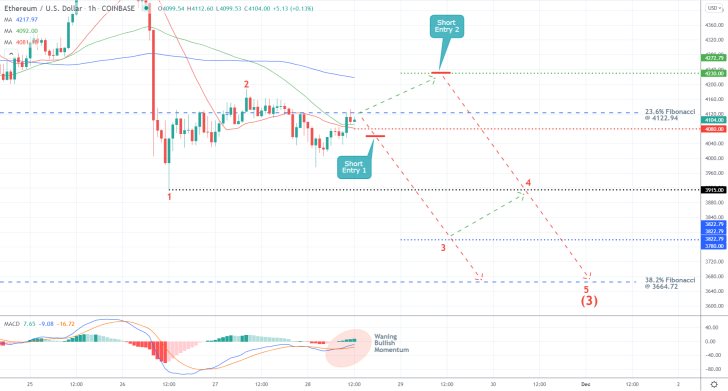
The significance of the 4230.00 resistance is also confirmed on the hourly chart below, seeing as how it was just crossed by the 100-day MA (in blue). Meanwhile, the crossover between the 20-day MA (in red) and 50-day MA (in green) just below the 23.6 per cent Fibonacci, underpinning the support at 4080.00, can be used by bears as a reference point. A breakdown below it could signal the continuation of the new downtrend.
The histogram of the MACD indicator is currently positive but very fragile; meanwhile, the 12-day EMA is threading above the 26-day EMA. Both indicate the persistence of a very weak bullish momentum. Its eventual termination will catalyse the continuation of the downtrend.
Concluding Remarks
Bears can look for a chance to sell either just below the range (around 4060.00) or around the 4230.00 resistance (provided that potential adverse fluctuations climb to it). In the first case, their supporting stop-losses should be laced around the 23.6 per cent Fibonacci. In the second, they should not exceed $0.40.
Once the price action draws near to the aforementioned support level at 3780.00, bears would be able to substitute their fixed stop orders for floating TPs. That way, they can still take advantage of a very likely dropdown to the 38.2 per cent Fibonacci while protecting themselves against the possibility of sudden bullish rebounds.
ETHUSD Once Again Threading Within the Distribution Range
The price action of ETHUSD is once again nearing the peak of the recent Distribution range, which implies a likely reversal for a second time over the last several days. Hence, the underlying setup may be favourable for the implementation of contrarian trading strategies.
Higher-risk assets, including Bitcoin, were able to recover this week from the partial selloff that emerged following the spread of the new Omicron variant. FED Chair Jerome Powell's testimony reassured markets that the FOMC would adopt a new approach towards mitigating the risks of inflation getting out of hand, which decreased the overall uncertainty.
Nevertheless, the overall risk is not yet completely removed, and seeing that the price of ETHUSD is nearing a major swing peak, the timing seems right for placing short positions on the expectations for another reversal from it.
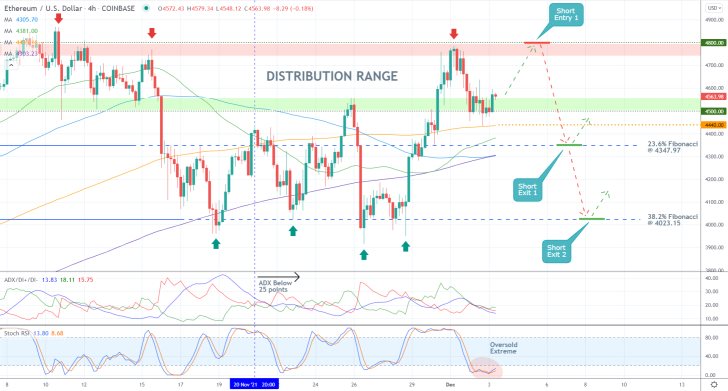
As can be seen on the 4H chart above, the price action is currently consolidating within a major Distribution range, as postulated by the Wyckoff Cycle theory. The range spans between the previous swing peak at 4800.00 and the major support level at 4500.00.
The ADX indicator has been threading below the 25-point mark since the 20th of November, underpinning the current range-trading conditions. This is why it may be prudent to pick tops and bottoms within the existing range under these conditions. Meanwhile, the Stochastic RSI is currently threading within its oversold extreme, which could prompt another upswing to 4800.00.
Bears can place short limit orders there. Entering around the current spot price would be a mistake because evidently there is still some bullish commitment remaining. They should implement very narrow stop-losses as well, not more than $40 above the upper limit of the Distribution range.
Bears should be mindful of several potential turning points. The first can be found just below the lower limit of the range at 4440.00. The major support level there is underpinned by the 200-day MA (in orange). The second one, unsurprisingly, is the 23.6 per cent Fibonacci retracement level at 4347.97. The latter is also converging with the crossover between the 100-day MA (in blue) and the 300-day MA (in purple), making it an even more prominent turning point.
Bears can either collect their running profits there or substitute their fixed stop orders for floating TPs in order to catch a potentially deeper dropdown towards the 38.2 per cent Fibonacci at 4023.15.
ETHUSD Ready to Fall After a False Breakout
The price action of Ethereum has been consolidating within the boundaries of a minor range over the last several days, which entails the possibility for the implementation of range-trading strategies. Given a recently failed breakout above the range's upper limit, bears may now attempt to sell ETHUSD on the expectations for a subsequent dropdown towards the range's lower boundary.
Bearish bias continues to prevail in the cryptocurrency market following a recent selloff. A sizable decline in the demand for high-risk assets continues to exert considerable selling pressure on ETHUSD and BTCUSD. This trend runs parallel to an uptick in demand for lower-risk securities, which is clearly discernible on the price of gold.
The selling pressure on ETHUSD could be bolstered tomorrow per the latest inflation rate numbers in the U.S. That is why the underlying setup seems suitable for the implementation of contrarian trading strategies by bears, looking to sell the price near the upper limit of the range.
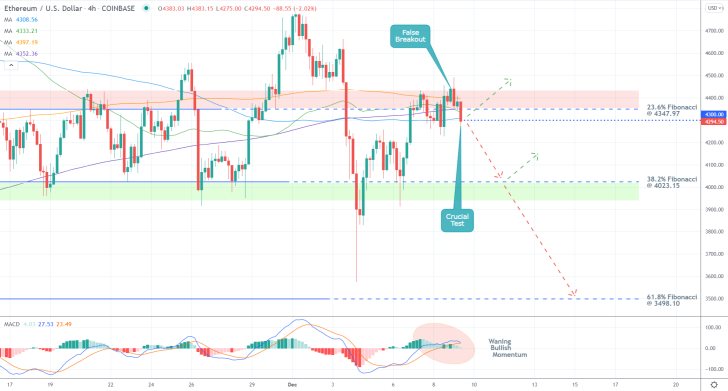
As can be seen on the 4H chart above, the range spans between the 23.6 per cent Fibonacci retracement level at 4347.97 and the 38.2 per cent Fibonacci at 4023.15. It is worth pointing out that a bundle of several moving averages is currently converging with the former.
These include the 100-day MA (in blue), underpinning the major support level at 4300.00, the 50-day MA (in green), 200-day MA (in orange), and 300-day MA (in purple). Given their close proximity to the 23.6 per cent Fibonacci, a decisive breakdown below 4300.00 would represent a very significant indication that the price action would be ready to continue falling towards 4023.15, possibly even deeper.
This is especially true given the recent false breakout above 4347.97 and the fact that the underlying bearish momentum is becoming increasingly stronger. This is illustrated by the declining histogram of the MACD indicator.
Bears can therefore look for an opportunity to enter short just below the support at 4300.00 (if the current 4H candle closes below it). Their supporting stop-loss orders should be placed just above the 23.6 per cent Fibonacci at 4347.97.
They can either place a take profit order at the 38.2 per cent Fibonacci at 4023.15 or conversely, bears could substitute their fixed stop orders for floating TPs once the price action draws near to it. That way, they would be able to generate bigger profits if the price action breaks below it and heads towards the 61.8 per cent Fibonacci at 3498.10.
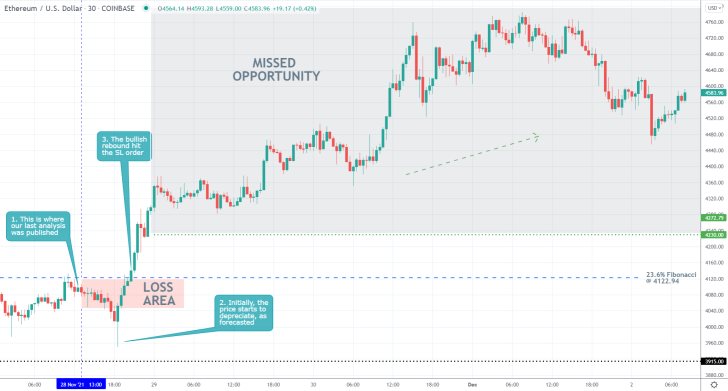
- The expectations of our last ETHUSD analysis were not realised at all. Despite some marginal initial success, the price action rebounded past the 23.6 per cent Fibonacci retracement level and started developing a new uptrend.
- The analysis expected the selloff to carry on this week owing to the Omicron variant, but this was not fulfilled due to renewed bullish enthusiasm.
- This is a good example of the hidden dangers of trading on fundamental news. You run the risk of interpreting them inaccurately and therefore go against the market.
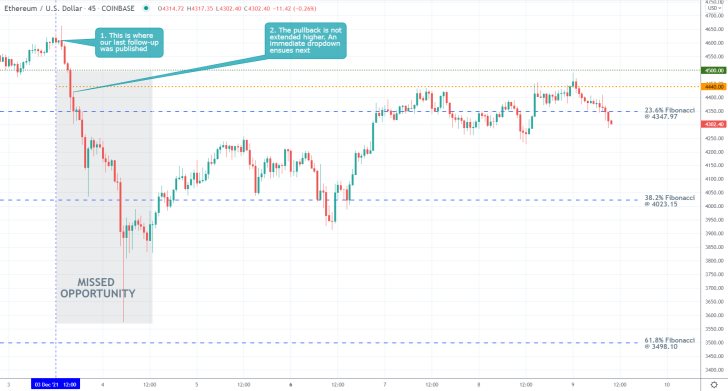
- Even though the price of ETHUSD fell almost to the 61.8 per cent Fibonacci retracement level at 3498.10, as was forecasted by our last follow-up, no profits were generated on the set-up.
- That is so because the price action started depreciating almost immediately after the release of the follow-up, while the expectations were for a minor bullish pullback to take place beforehand.
- Such instances may be a source of great frustration for traders who have done everything right, except taking advantage of their forecasts.
- Nevertheless, they should not let their frustration cloud their future judgements.
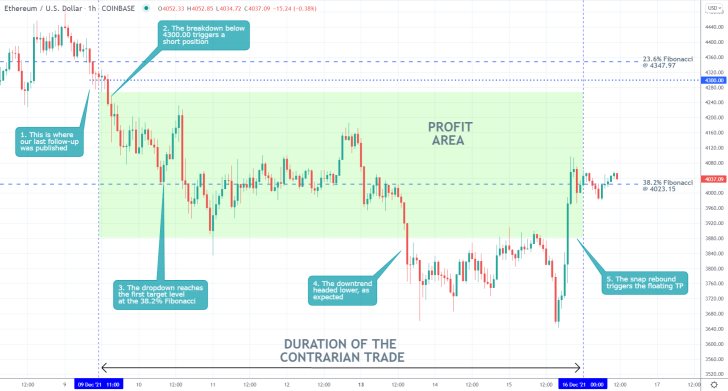
- Our last ETHUSD follow-up was a huge success! It forecasted a major dropdown from the 23.6 per cent Fibonacci retracement level at 4347.97 and a penetration below the 38.2 per cent Fibonacci at 4023.15.
- This is a good example of the benefit of using floating TPs. It allowed for the trade to catch a huge chunk of the dropdown below the 38.2 per cent before the snap rebound took place.
Disclaimer: Your capital is at risk! Trading and investing on the financial markets carries a significant risk of loss. Each material, shown on this website, is provided for educational purposes only. A perfect, 100% accurate method of analysis does not exist. If you make a decision to trade or invest, based on the information from this website, you will be doing it at your own risk. Under no circumstances is Trendsharks responsible for any capital losses or damages you might suffer, while using the company’s products and services. For more information read our Terms & Conditions and Risk Disclaimer.


