The Nasdaq composite index completed a major 1-5 impulse wave pattern recently, as postulated by the Elliott Wave Theory. It was then followed by a corrective ABC structure, which implies the completion of a major cycle. Since the price action very possibly finds itself in the early stages of a new major cycle, this could present traders with the opportunity to enter early into the development of a new trend.
And the timing also seems perfect, given that Big Tech companies, including Apple, Microsoft, Alphabet, Amazon and Facebook, are scheduled to publish their quarterly earnings this week. The quarterly reports of the world's biggest technology companies are bound to cause an upsurge in volatility on the leading technological index in the U.S., which could be taken advantage of by swing traders.
The Nasdaq had already started exhibiting increasing volatility last week when its price action rebounded from a recent dip. The cause was a global resurgence of demand for riskier assets, inspired by Bitcoin's rally to a fresh all-time peak.
Depending on how the price action behaves around the closest support and resistance levels next, traders would be able to decide whether to implement trend continuation or contrarian trading strategies.
A New Double Top in the Making?
As can be seen on the daily chart below, the bullish 1-5 impulse wave pattern, underpinning the latest uptrend, was terminated at the 15400.00 resistance level. This demonstrates the significance of the latter as a significant make-it-or-break-it threshold.
Subsequently, the price action started developing the corrective ABC pattern, which bottomed out at the 38.2 per cent Fibonacci retracement level at 14257.00. This is noteworthy because it indicates that bulls retain overall control in the market. However, there are reasons to expect that the current correction is not yet fully completed.
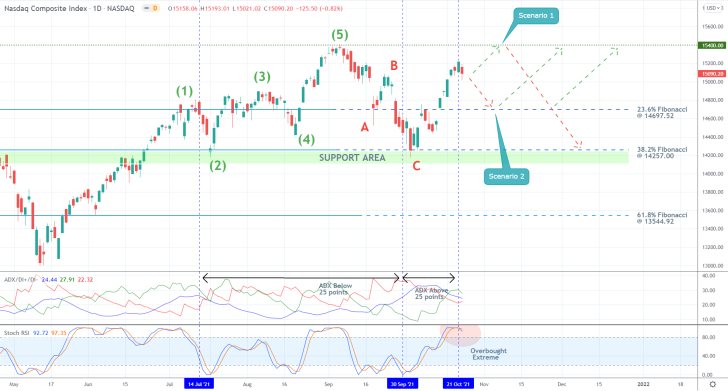
Pay attention to the ADX indicator. It has been threading marginally above the 25-point benchmark between the 30th of September and the 21st of October. This means that the pullback from the 38.2 per cent Fibonacci should not be considered as a new uptrend on its own.
Given that the underlying market sentiment can barely be considered trending, the price action could very possibly establish more marginal dropdowns in the near future. The indecisiveness of the market is further underscored by the Stochastic RSI indicator, which has entered into its overbought extreme recently. This is likely to prompt extra selling pressure just below the previous swing peak at 15400.00.
Scenario 1 underpins the possibility of the current pullback being extended towards this historically significant resistance level before a new sizable dropdown ensues. Bears would thus be able to sell around 15400.00 on the expectations for the development of a new Double Top, a classic trend reversal pattern. The dropdown could then head towards either the 23.6 per cent Fibonacci at 14697.52 or the aforementioned 38.2 per cent Fibonacci at 14257.00.
Scenario 2 implies the possibility of an immediate dropdown (following the market open on Monday). It could fall as low as the 23.6 per cent Fibonacci retracement level before bulls get a chance to buy the dip, though a bullish rebound could occur even before that.
Buying the Dip
The 4H chart below provides an even more intricate overview of the critical pressure points that need to be taken into consideration; chiefly, the resistance-turned-support at 14900.00. Its role as a critical threshold was confirmed when it terminated the second impulse leg (2-3) of the 1-5 pattern.
At present, the 14900.00 level is being crossed by the 100-day MA (in blue) and the 20-day MA (in red), both of which serve as floating supports. This makes it an even more prominent turning point. Moreover, it is positioned just below the psychologically significant support level at 15000.00.
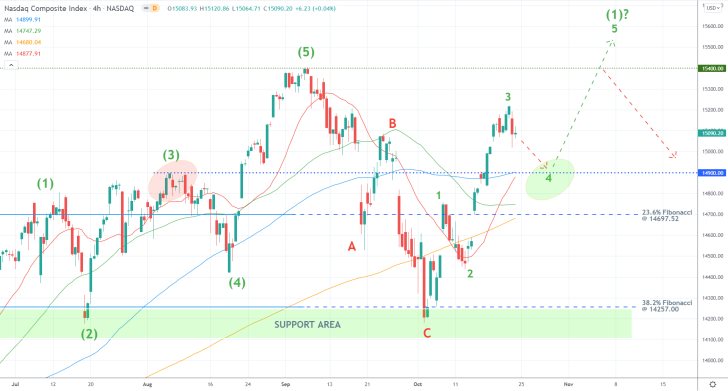
Assuming that the price action is beginning to develop a new sizable (bullish) 1-5 impulse wave pattern, the current pullback would serve the role of its initial impulse leg (0-1). And given the fractal nature of Elliott patterns, it itself would likely be structured as a minor 1-5 wave pattern.
All of this corroborates the expectations for an immediate dropdown to the resistance-turned-support at 14900.00, which would represent the second retracement leg (3-4) of this minor 1-5 Elliott pattern. This is where bulls could lock in their buying orders on the expectations for a subsequent rebound (the 4-5 impulse leg) towards the previous swing peak at 15400.00.
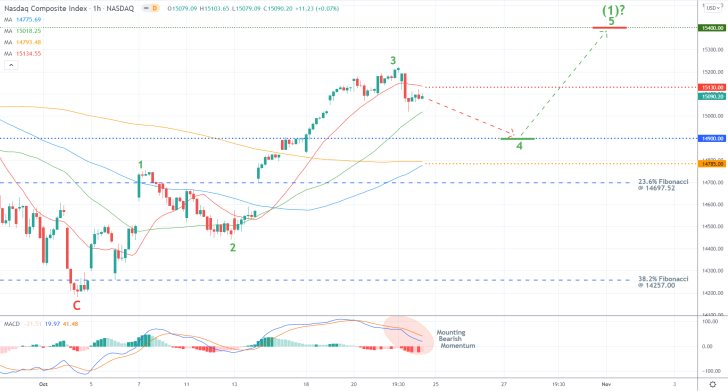
The MACD indicator on the hourly chart below demonstrates the rapidly rising bearish momentum in the short term. This substantiates the forecasts for a subsequent dropdown towards 14900.00.
Bulls should keep an eye on the 200-day MA (in orange) and the 100-day MA (in blue), which are currently converging at 14785.00. The two moving averages can be used as reference points by bulls deciding where to place their stop-loss orders. It would depend on where the two are positioned in relation to the 14900.00 support level once the price action falls to it.
Concluding Remarks
Bulls can consider placing long limit orders around 14900.00, provided that the market does not open with a massive gap on Monday. At any rate, they should not place their supporting stop-loss orders below the 200-day MA (as seen on their hourly charts). Alternatively, they could place them no more than 100 basis points below their initial entries, depending on their level of risk-aversion.
Once the price action nears the previous swing peak at 15400.00, they could substitute their fixed stop orders for floating TPs in order to squeeze the maximum out of a potential breakout into previously uncharted territory.
Bulls should also keep in mind that any potential surprises in the earnings reports of any of the Big Tech companies could cause sudden spikes in the price action in either direction. This level of unpredictability is only suitable for proactive traders. More cautionary reactive traders could wait for the earnings reports to be delivered before they join the market.
Waiting to Buy the Next Dip on the Nasdaq
The Nasdaq composite rallied in the wake of the latest robust earnings numbers of Big Tech, reaching a new all-time high. The likelihood of the uptrend being extended even further up north in the near future is considerable. However, that does not preclude the possibility of an intermittent correction.
Bulls can take advantage of this by buying the dip of the next dropdown. Such trend continuation trading strategies would entail going long around a prominent resistance-turned-support level. A potential catalyst of such a dropdown could be the November policy meeting of the Federal Open Market Committee (FOMC), which is scheduled to take place later today.
The Committee is scheduled to deliberate on the latest inflationary pressures in the U.S., and adjust its monetary policy stance accordingly. And if the FED decides to adopt a slightly more hawkish outlook, akin to what the ECB did, this could jolt investors' enthusiasm enough to prompt a temporary correction on the price of the Nasdaq.
That is so because any hints at possible recalibrations of FED's massively accommodative stance would spell the beginning of the end of the happy times on the stock market.
Bulls should therefore remain patient and wait for their chance to join the current uptrend at the most opportune moment.
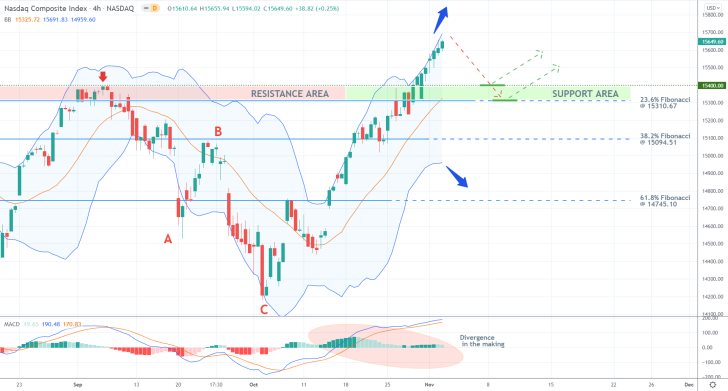
Notice that the underlying volatility levels have been growing over the last several days, as indicated by the widening Bollinger Bands on the 4H chart above. At the same time, the histogram of the MACD indicator has been declining. This represents a potential divergence currently in the making, which could be interpreted as an early indication of an upcoming correction.
Such a correction is likely to bottom out around the nearest resistance-turned-support area (in green). The latter spans between the 23.6 per cent Fibonacci retracement level at 15310.67 and the previous swing peak at 15400.00. Notice that the middle line of the Bollinger Bands - 20-day MA (in orange) - is currently converging with the 23.6 per cent Fibonacci, making it an even more prominent support.
Bulls can place long limit orders anywhere within this area. Their supporting stop-loss orders should not be placed at more than 50 basis points below the 23.6 per cent Fibonacci. As regards their targets, once bulls join the next rebound, they can wait for the price action to come close to the current swing peak (around 15650.00) before they utilise floating TPs. That way they would be able to squeeze the maximum out of the subsequent breakout into uncharted territory.
The Nasdaq Testing the Psychological Resistance at 16000.00
The price action of the Nasdaq composite index is currently trading at an all-time high, signifying the strong bullish bias that drives the market at present. However, the price action also probes the psychologically significant resistance level at 16000.00, which is a prominent turning point. This is where a bearish correction is most likely to emerge from next.
The stock market has benefited greatly from the strong economic numbers that have been recorded recently, primarily the robust employment data for October. However, FED's decision to start tapering its asset purchases from December is likely to weigh down on investors' enthusiasm as liquidity gets scaled-down, thereby possibly having an adverse impact on the value of the Nasdaq.
Thus, the underlying fundamentals seem to corroborate the expectations for a subsequent correction on the Nasdaq. Bears can therefore implement contrarian trading strategies on the current setup. They should, however, keep in mind that this would also entail the risk of adverse fluctuations, which is why this trading opportunity is not suitable for highly risk-averse traders.
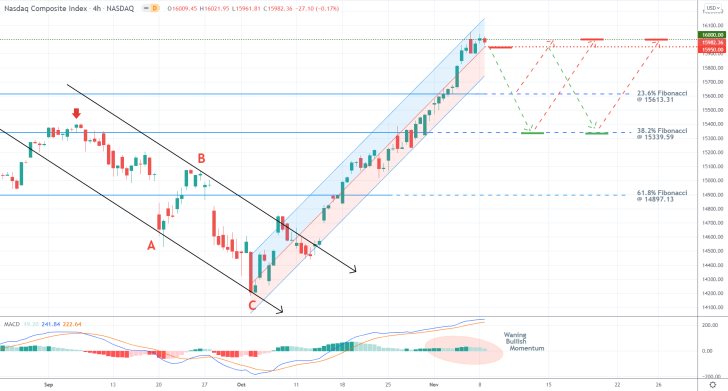
The latest upswing, which is represented as a regression channel on the 4H chart above, has just reached the psychologically significant resistance level at 16000.00. A decisive breakdown below the middle line of the channel, currently at 15950.00, would signal the beginning of the correction.
The beginning of such a correction is likely to occur very soon, given the presently waning bullish momentum. This is underscored by the MACD indicator, whose histogram has been declining steadily over the last several hours, underpinning a divergence in the making.
The preceding correction, represented as an ABC structure outlined by two descending trend lines (in black), can be used as a reference point to determine the next correction's likely targets.
Provided that today's trading session does not open with a massive gap, bears can sell just below 16000.00. Their supporting stop-loss orders should not be placed more than 90 basis points above this psychological threshold.
The first target for such a correction is encapsulated by the 23.6 per cent Fibonacci retracement level at 15613.31. Once the price action draws near to it, bears would be able to substitute their fixed stop orders for floating TPs. That way, they would be able to squeeze the maximum out of a potential dropdown towards the 38.2 per cent Fibonacci at 15339.59 while protecting themselves against potential bullish upturns.
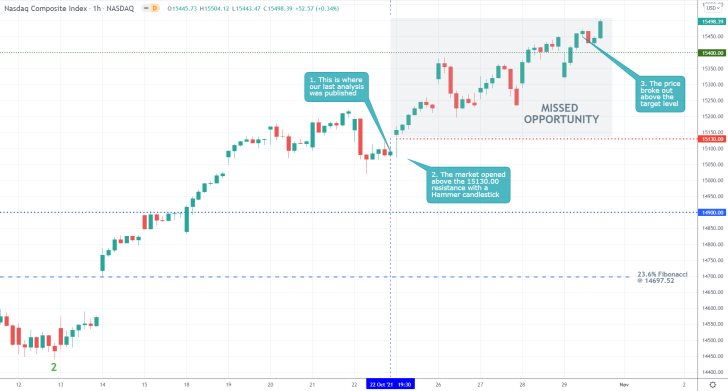
- Even though the price action of the Nasdaq composite did reach the 15400.00 resistance level, as was forecasted by our last analysis of the index, the analysis failed to take advantage of the upswing. That was so because an initial dropdown to the 14900.00 support level was expected before the uptrend could be extended higher.
- The emergence of a Hammer candlestick after the market open (the first one following the release of the analysis) should have been perceived as a strong bullish indication. Thus, the weakest aspect of the analysis was its failure to account for the possibility of trend continuation without an intermediate correction.
- Simply because the market is overbought/oversold does not mean that there would necessarily be an immediate correction.
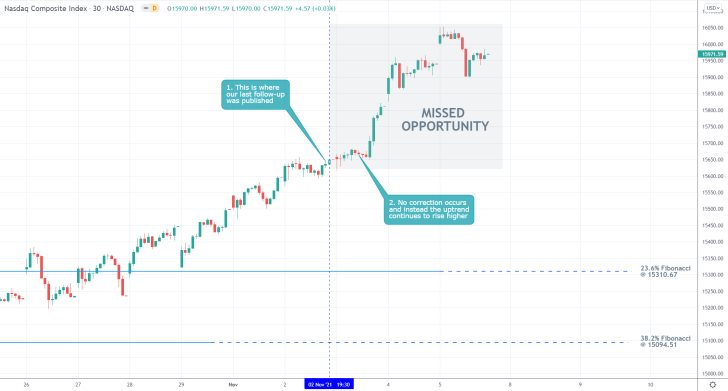
- The projections of our last analysis of the Nasdaq composite index did not exactly pan on. Following its publication, the price action did not establish a correction to the 23.6 per cent Fibonacci retracement level at 15310.67, as was expected. Instead, the underlying uptrend was extended higher.
- Even though no profits were generated on this particular instance, the analysis succeeded in more ways than it failed. It would have been a mistake to enter an existing uptrend at a swing peak precisely because of the risk of corrections.
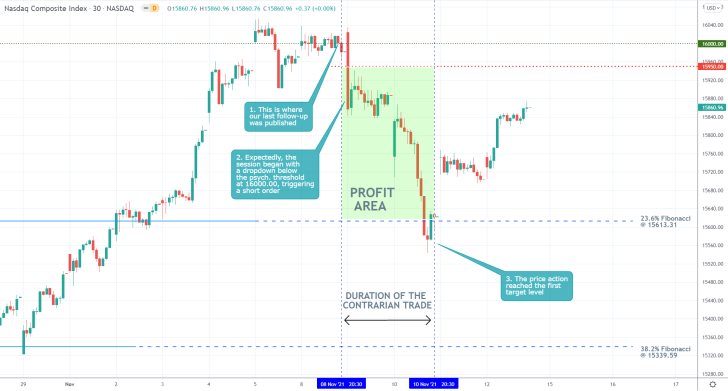
- Our last analysis of the Nasdaq composite index was a massive success.
- Its forecasts for an immediate reversal of the price action from the psychologically significant resistance level at 16000.00 shortly after its release were realised.
- The price action then went on to fall to the 23.6 per cent Fibonacci retracement level at 15613.31, as projected.
Disclaimer: Your capital is at risk! Trading and investing on the financial markets carries a significant risk of loss. Each material, shown on this website, is provided for educational purposes only. A perfect, 100% accurate method of analysis does not exist. If you make a decision to trade or invest, based on the information from this website, you will be doing it at your own risk. Under no circumstances is Trendsharks responsible for any capital losses or damages you might suffer, while using the company’s products and services. For more information read our Terms & Conditions and Risk Disclaimer.


