The price of crude oil has finally started falling from the recent high, which was expected to happen for quite a while now. The commodity rallied in the first quarter, driven by heightened demand as the global economy continues to recuperate, but this bullish sentiment finally looks ready for a respite.
Energy demand caused consumer prices to rise parallel to the rally of crude oil, which led to massive upsurges in headline inflation in the U.S. and the UK. But now that investors are becoming increasingly more worried about inflation getting out of hand, this could ease the buying pressures responsible for the rally in the first place.
Despite the expectations for another downtrend/bigger correction, traders should keep in mind that the longer-term sentiment continues to be prevailingly bullish-oriented. More and more specialists are signalling the beginning of a new supercycle, which is likely to keep prices high in the long term. This, however, does not preclude the possibility of more sizable dropdowns emerging in the short term, which is what this analysis is focused on.
The Breakdown Below the Triangle is a Major Bearish Signal
The price of crude finally broke down below the lower boundary of the bearish triangle, as seen on the daily chart below, which serves as the selling signal bears have been waiting for. The triangle morphed from the Double Top pattern that was recognised in our last analysis of WTI.
The breakdown comes after two tests of the triangle's lower boundary and three attempts at its upper end, which signifies the likelihood of a new trend reversal. Given that the price has already penetrated below the 50-day MA (in green) at 62.50, its next target for the downtrend is represented by the psychologically significant support level at 60.00.
The latter is currently being crossed by the 100-day MA (in blue), which makes it an even more prominent turning point. Meanwhile, the 20-day MA (in red) has adopted a new role since yesterday, that of a floating resistance.
Once the price reaches this psychologically significant threshold at 60.00, a minor bullish pullback could emerge from it next. Such a movement is likely to test the 50-day MA from below, which would allow bears to potentially add to their short orders by selling near 62.50.
The 38.2 per cent Fibonacci retracement level at 54.78 and the 61.8 per cent Fibonacci at 46.71 serve as deeper targets for a potentially more sizable bearish dropdown.
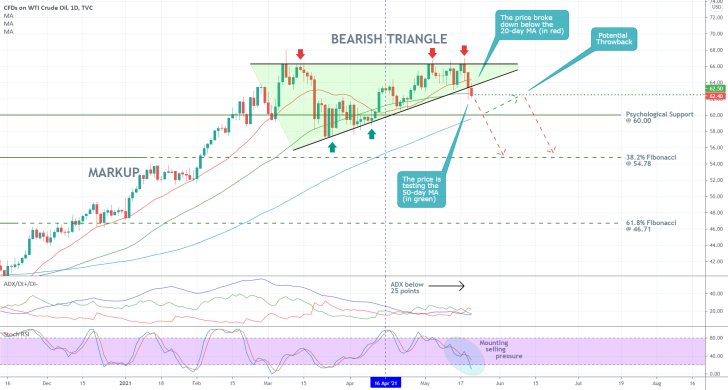
The ADX indicator has been threading below the 25-point benchmark since the 16th of April, which confirms the termination of the preceding uptrend. Accordingly, the Stochastic RSI indicator is demonstrating rising selling pressure. Both of these factors substantiate the expectations for continued price depreciation in the near term.
Breaking the Ascending Channel
The underlying outlook is prevailingly bearish in the short term, too, as can be seen on the 4H chart below. In addition to penetrating below the lower end of the major ascending channel, the price of crude also managed to break down below the support-turned-resistance level (in black).
The 200-day MA (in purple) and the 300-day MA (in orange) were also broken decisively by the recent dropdown, taking the form of a Marabozu Engulfing candle. This happens after the initial probing of the two moving averages, confirming the very robust bearish bias in the short term. Moreover, the MACD indicator, too, is exhibiting mounting bearish momentum.
There seems to be a confluence of bearish signals at present, which would justify the execution of selling orders on the current setup.
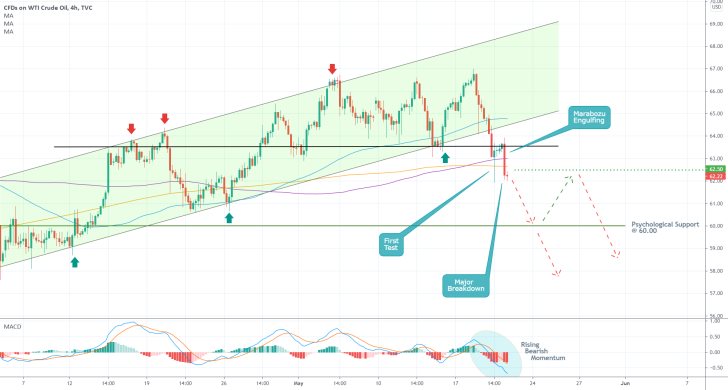
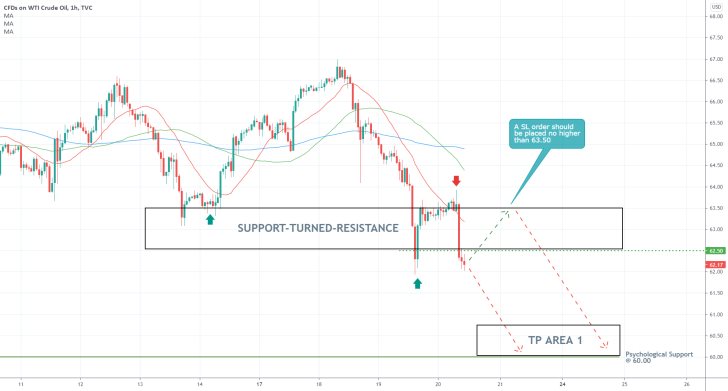
Market bears can look to sell just below the lower end of the major support-turned-resistance area (around 62.50). They should place their stop-loss orders no higher than the upper limit of the area (around 63.50).
Once again, they should look at the moving averages for guidance. At present, the 20-day MA is the closest to the price action, making it the nearest floating resistance. This, too, can be used as a risk management benchmark.
Concluding Remarks:
As stated earlier, the first target for market bears is encapsulated by the psychological support level at 60.00, which is where they should place their take profit orders.
Even though there is a good chance that the price would eventually reach the 23.6 per cent Fibonacci retracement level, such a downtrend is unlikely to evolve without intermittent bullish pullbacks. That is why bears should set for themselves realistic goals.
Once the price reaches the initial goal, they could then start looking for opportunities to use trend continuation strategies - selling at the peaks of such intermittent pullbacks.
The Price of Crude Oil Continues to be Range-Trading
The price of the commodity has been trading in a range over the past couple of weeks as the underlying demand and supply pressures appear to be equalising in the short run. That is in spite of the massive new supercycle that is just now coming to prominence in the commodities market.
Energy demand is falling marginally ahead of the summer holidays in the Northern Hemisphere, even though it remains quite sold on the whole. This was also underpinned by the RBNZ yesterday, at the policy meeting of the MPC.
The primary reason for the indecisiveness in the market is the lack of any major economic releases in the calendar for this week, which creates the muted underlying conditions that we are currently observing. That is why as regards the price of crude oil, the only reasonable approach that can be utilised at present would be to use range-trading strategies.
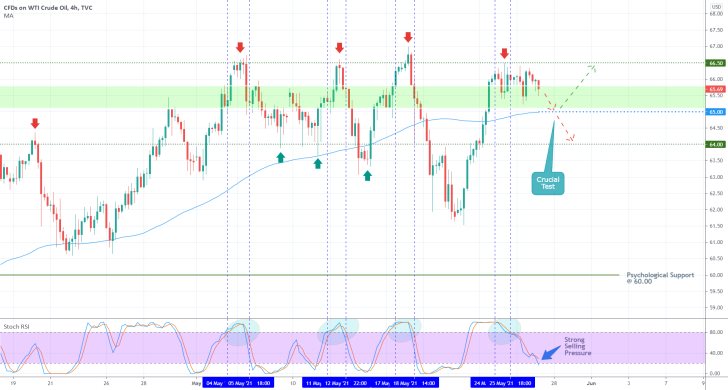
As can be seen on the 4H chart above, the price of crude oil is contained in a range spanning between the major support level at 64.00 and the major resistance level at 66.50. This is the type of market environment that is most suitable for the implementation of the Stochastic RSI indicator, which takes into account subtle changes in the underlying buying and selling pressures.
Each time that the RSI was threading in its overbought extreme, the price action was simultaneously probing the upper boundary of the range, which was followed by subsequent reversals. This also appears to be happening at present, even though the price is slow to react to the rising selling pressure.
This can potentially be utilised by bulls and bears alike. Bears can try to sell at the market price, however, they should consider this in light of likely adverse pullbacks to 66.50. The crucial test for bears is encapsulated by the minor support at 65.00 (the lower end of the support area in green), which is currently underpinned by the 100-day MA 9in blue).
If the price action manages to penetrate below it, then the correction would likely be extended further down south, towards the range's lower end - at 64.00. Conversely, if the price of crude rebounds from 65.00, this would signify resilience in the market. Bulls would then be able to buy in at the resulting dip, eying a potential test of 66.50 afterwards.
OPEC's Minutes Could Drive Oil Higher
The price of crude oil is likely to continue rising over the next several days, driven by reinvigorated bullish momentum in the commodities market. The OPEC meeting scheduled for tomorrow will likely catalyse a renewed uptrend.
OPEC is expected to emphasise the continued joint efforts to balance the supply side of the market, which has contributed significantly to the latest rally. Stating that its members remain committed to reducing aggregate output would be good news for bulls.
Thus, the price is likely to continue rising following a recent breakout from a major range, though this is not entirely certain. The price of crude was ranging until recently, which could turn the aforementioned breakout into a sharp dropdown.
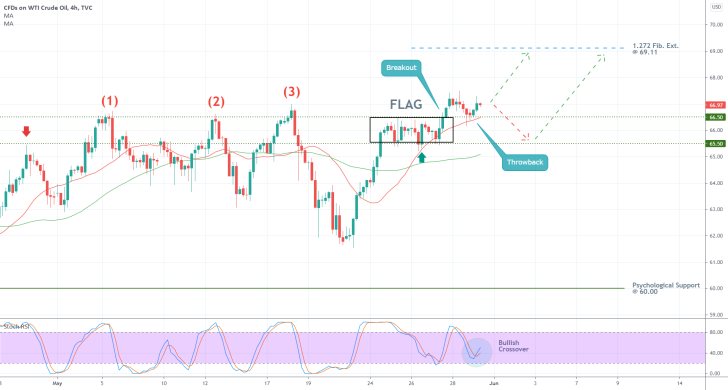
As can be seen on the 4H chart above, the price broke out above the upper boundary of a massive range, at 66.50. This critical threshold served as a turning point on three separate occasions in the past, which is why this breakout is so important. It could potentially lead to a new massive upswing; however, it could also pan out to be nothing more than a false breakout.
Prior to the breakout, the price action had established a Flag (between 66.50 and 65.50), which is a type of pattern that typically entails potential rend continuation. This serves as yet another bullish indication.
Following the breakout, the price action established a throwback to 66.50 from above, which also rebounded from the 20-day MA (in red). Bulls can use this confirmation of the existing bullish pressure above the resistance-turned-support as a buying opportunity.
They can go long around the current market price, placing a very narrow stop-loss just below 66.50. Their first target is encapsulated by the nearest Fibonacci extension level - the 1.27 per cent at 69.11. On the condition that the price action was to drop down to 65.50 once again, bulls would then be able to buy near the resulting dip.
At any rate, bulls should keep in mind that the market was range-trading until recently, which means that there is a danger of adverse fluctuations around the upper boundary of the previous range. In other words, they should consider the likelihood of the breakout actually being a fakeout.
Finally, the Stochastic RSI indicator underpinned a bullish crossover, which is inlined with the primary expectations.
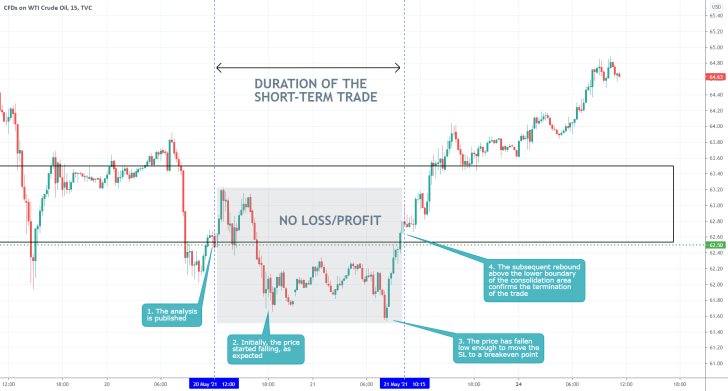
- The analysis did not yield any results in the short term; however, it should be stated that this is only due to the implementation of proper risk management.
- Traders will limit much of their losses if they remember to move the SL to a breakeven point once the price action has moved sufficiently in their favour. Otherwise, they risk incurring bigger losses when the market turns sharply and unexpectedly.
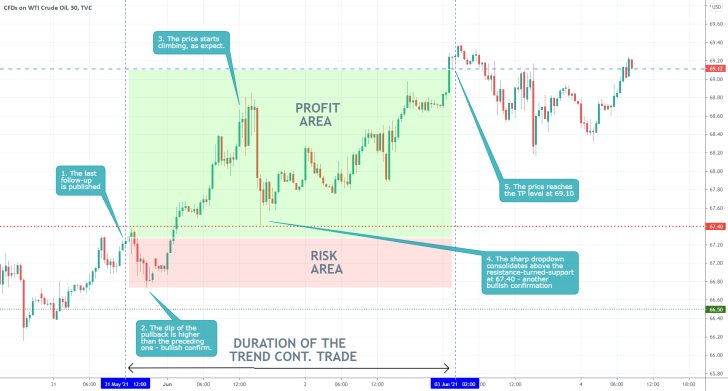
- The price of crude oil behaved exactly as per the expectations of our last follow-up analysis, in that it eventually reached the target level at 69.10. Before it did so, however, a minor bearish pullback occurred shortly after the release of the follow-up.
- That is why traders should keep in mind that trend-continuation trading strategies (as regards entering into a trade) are best implemented at the dips of pulldowns or at the peaks of pull-ups (for selling).
Disclaimer: Your capital is at risk! Trading and investing on the financial markets carries a significant risk of loss. Each material, shown on this website, is provided for educational purposes only. A perfect, 100% accurate method of analysis does not exist. If you make a decision to trade or invest, based on the information from this website, you will be doing it at your own risk. Under no circumstances is Trendsharks responsible for any capital losses or damages you might suffer, while using the company’s products and services. For more information read our Terms & Conditions and Risk Disclaimer.


