The precious metal has been advancing in an incredible bullish trend that was started over a year ago. Market experts have been analysing the underlying causes that led to this considerable price hike, and most of them attribute it to major socio-economic and political developments internationally. The trade war between the US and China has been at the epicentre of public discourse, while the unpredictable policymaking of Donald Trump has stirred the global markets more than once. Both of these assertions have been postulated as possible explanations for the seemingly unstoppable surge in demand for gold. With the recent outbreak of the coronavirus in China, many market experts feared that the sweeping investors’ panic could prompt even more capital flight to safe-haven assets such as gold.
In light of these and other fundamental events, however, the commodity is showing signs of a possible short-term correction, which could, at least temporarily, interrupt the development of the bullish trend. Many traders wonder if this correction could become a sizable downswing and even initiate a trend reversal, or if it is going to turn out to be nothing more than an unremarkable suspension of the price action before the continuation of the major upwards movement. The current analysis delves into these and other questions related to the near-term future of the world's most desirable commodity.
1. Long-Term Outlook:
The price of gold temporarily surpassed the psychological level of 1600 on the 8th of January before reverting back within range. This short-lived milestone is represented on the weekly chart below by the shooting star candlestick, which typically is found towards the end of established bullish trends and is taken to indicate a likely bearish reversal. The fact that the price has, at least for the time being, managed to bounce back from this psychological price level (a potential turning point) in addition to the massive upper-shadow of the shooting star, are two of the main reasons why traders are weighing on the likelihood of the formation of a bearish correction or even of a full trend reversal.
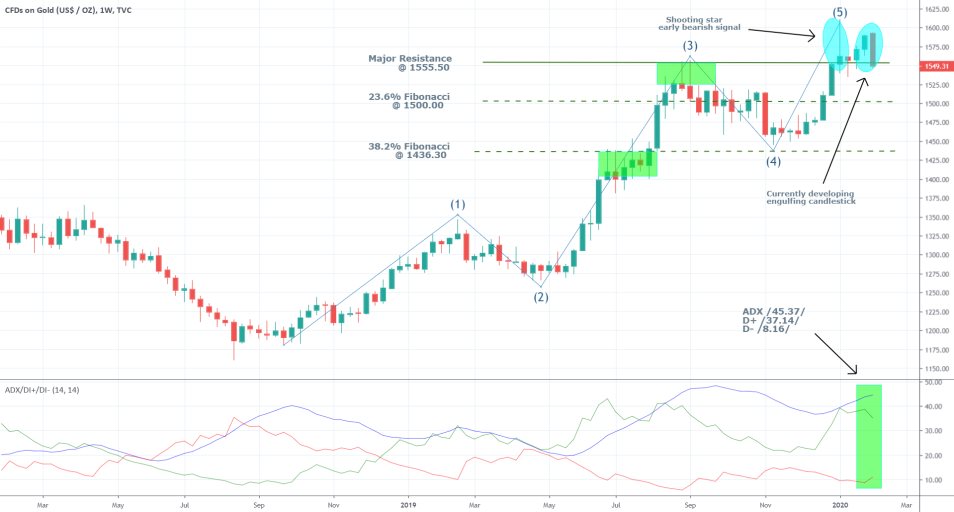
Contrarily to the above assertions, the ADX, which is currently at 45 points (25 and above demonstrates trending environment), is illustrating the strength of the trend and the predominantly bullish sentiment in the market. Therefore, even if there are short-term indications for a likely price correction, the strength of the bullish trend should not be underestimated. The fact that D+ is at 37 and D- is at 8 is yet another inkling of the huge disparity in the market pressures that are currently affecting the price action. Overall, the ADX is a reminder that even if the market is in the process of creating a bearish correction, it would be in the very early steps, and therefore bears should approach the present market setup with extreme caution.
The Elliott Wave Theory supports this hypothesis regarding the likely formation of a new bearish correction in addition to the nature of supply and resistance levels and basic chart art theory. First of all, the price appears to have formed the 1-5 wave pattern with the final impulse closing below the aforementioned psychological level, which presupposes a potential creation of a corrective ABC pattern.
Additionally, the price appears to be consolidating around the major support at 1555.50, which was established as a prominent resistance level at the top of the third impulse wave (the upper green rectangle). Thus, if the price manages to break down below 1555.50 successfully, the bears would be given another reason to believe in the strength of the rising bearish commitment in the market.
Also, this week’s candle is of the so-called Marubozu type, which is manifesting rising strength of the price action. Candles with massive bodies and very short tails usually represent strong directional movement in the price, which, in this case, is exhibiting the solid bearish sentiment in the short-term. This candle is also said to be engulfing, because its body is already more massive than the body of the preceding week’s candle, and it is headed in the opposite direction. In short, such engulfing candles are said to represent likely change in the direction of the price action.
2. Business Confidence; Safe-Haven Assets and Other Fundamentals:
As it was already mentioned, at times of panic and general fear across the markets, investors tend to seek protection for their capitals, which results in capital flight to so-called safe-haven assets, which are considered to be stable at times of crisis because they bare minimal risk. One such safe-haven asset is the Japanese Yen, more on which you can read here. Gold is another.
As business confidence started to fall globally owing to the rising investors’ fears stemming from the trade war (before the signing of Phase One Trade Deal between the US and China), the gold and US government treasuries became especially desirable among investors. As a result, the yield of most US bonds started to fall, which led some market experts to fear that the heightened demand for low-risk treasuries would cause problems in itself.
Commonly, the falling yields of government treasuries indicate the removal of capital from the general economic circulation to set bonds, which, in turn, impedes growth. The same is true for gold, as investors' capital that is locked in on gold cannot be used for financing the business activity in a country. Therefore, low bonds' yields and the soaring price of gold typically run opposite to each other and can be observed at times of general market distress. Subsequently, this trend can be expected to reverse once the direction of the geopolitical tensions shift and the overall panic on the market begins to lessen. Thereby, an increase in bonds' yields can be taken as a likely indication of a potential fall in gold's price. The opposite is true for US bonds. Consider the following chart:
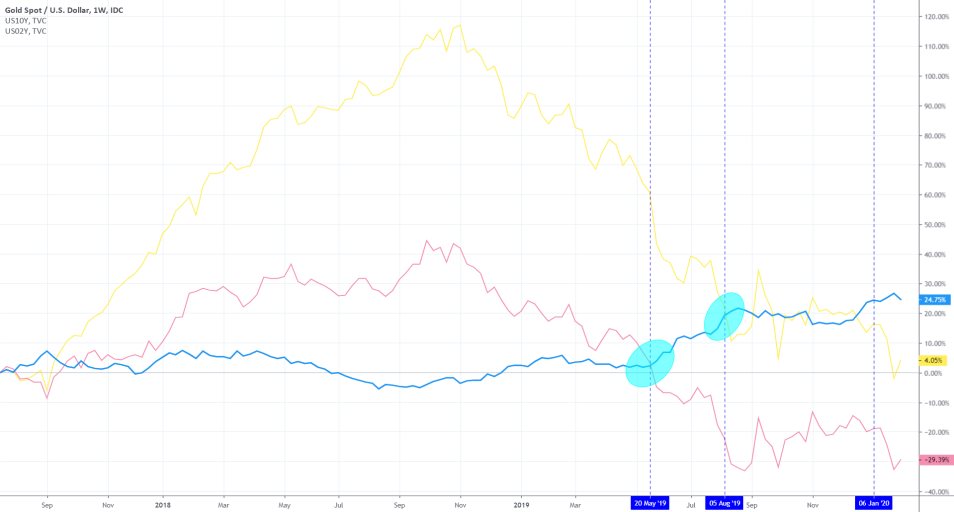
The two crossovers, highlighted by the blue areas, exemplify the trend of falling US bonds’ yields relative to the rising gold price, which was exceptionally prevalent at the time of the international trade tensions. However, the most recent developments point to a moderate increase in the US10Y and US03Y’s yields, which is suggestive of marginally improving investors’ outlook. If this general optimism continues to prevail in the forthcoming days, there is a good chance that the demand for gold would ease off as well, potentially leading to a decrease in the commodity’s price.
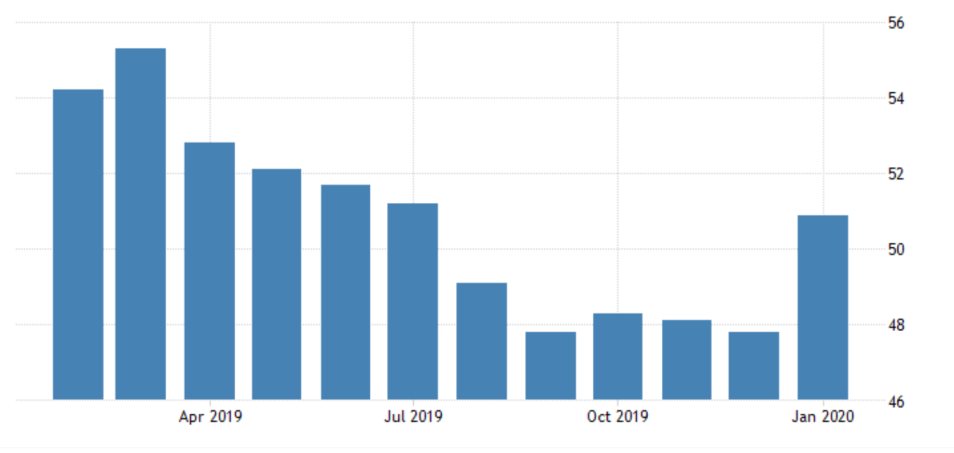
As the ISM Manufacturing PMI chart above indicates, the US businesses' confidence has recently peaked to a 6-month high, which is highly indicative of the calming of the situation. This, in turn, could very likely cause the general distress to subside and consequently result in diminished demand for safe-haven assets, including gold.
3. Short-Term Outlook:
The recent indications pointing to a potential stabilisation of the situation have prompted the downswing in the last two days, as illustrated on the daily price chart below.
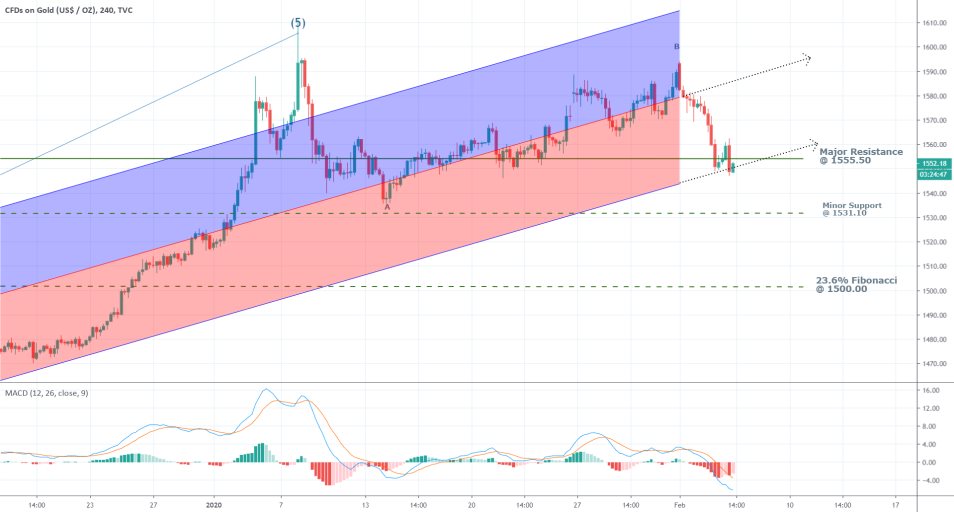
The price is attempting to break down below the 1555.50 level, which coincides with the ascending channel’s lower boundary. Thus, if the price manages to remain trading below that level, there would be even more evidence supporting the formation of a more considerable correction. If, however, the price bounces back up from set level, the correction might be proved to be short-lived. That is why bears are advised not to rush getting into the market, and instead wait to see whether there is enough commitment in the market for the price to achieve such an important breakdown.
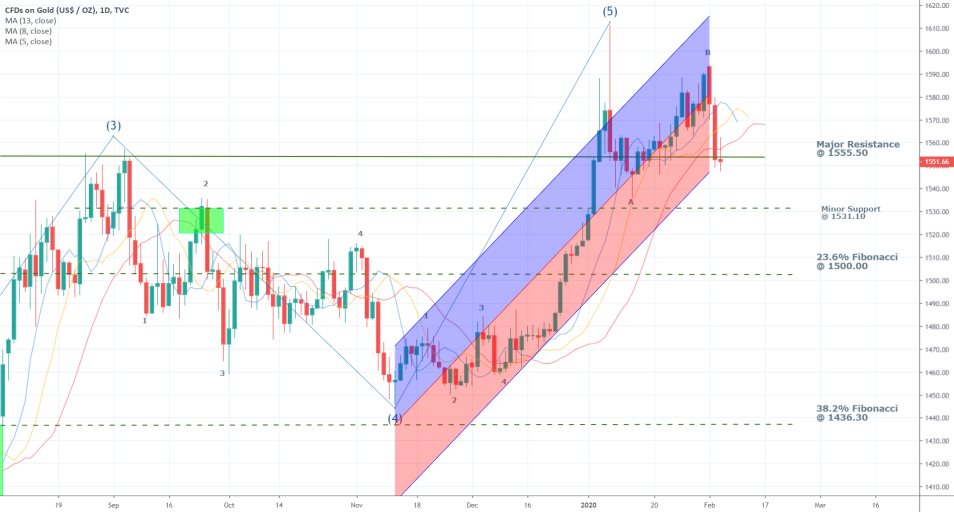
The 4H price chart provides an even more in-depth look at the pivotal turning point that is currently developing. The price is simultaneously testing the strength of the channel’s lower boundary as well as the support (resistance) level at 1555.50. The MACD is ostensibly bearish, confirming the strong downwards momentum.
Turning back to Elliott Wave Theory, it can be asserted that the price action appears to be at the lower end of a short-term cycle, which means that the ABC correction could already be terminated. Therefore, a new 1-5 wave pattern might be due for establishment in either direction (a new trend). If the price rebounds from the 1555.50 support, it could be taken by the bulls as an indication for the formation of a new bullish impulse. Hence, both buyers and sellers would be watching quite cautiously what the price does next. Its behaviour next would reveal whether the current bearish correction would be extended into a more considerable downswing movement, or whether the 1555.50 level would provide an ideal opportunity for the bulls to enter long at a discount (at the potential dip of the short-term correction).
4. Concluding Remarks:
If the correction is extended below the 1555.50 price level, bears will hope to see a healthy fall to at least the minor support at 1531.10, which is just below the dip at A. On the condition that such a movement does indeed occur, any further downswings would depend on the subsequent development of the situation with the novel coronavirus. If the general panic stemming from the spread of the virus begins to wane, the price of gold would likely continue to tumble. The next crucial target-level would be the 23.6 per cent Fibonacci retracement level at 1500.00, which has psychological importance as well (owing to the many zeroes it is a likely candidate for a new turning point as well).
If the price rebounds from 1555.50, however, and the bulls take charge once again, the first major target would be the 1600 mark, which was already failed once before in 2020.
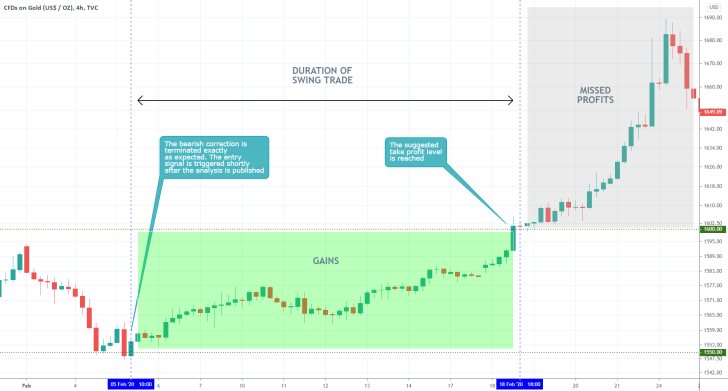
- The expectations for further extension of the bearish correction in the short-term were not realised, which led to 8-9 dollars in incurred losses. In hindsight it is now known that the demand for gold would only rise after the 5th of February due to the escalation of the coronavirus crisis, which was not certain back then, so the SL levels were accurate. The emphasis on the 1550.00 level as a prominent turning point was instrumental in preventing bigger losses. Meanwhile, the longer-term swing trade yielded 50 dollars in profits, as the price action did indeed reach the psychological significance at 1600.00. The issue here was that the trade was closed prematurely, which resulted in a lot of missed potential. The biggest takeaway here is that the market for commodities is especially driven by changes in supply and demand. So, one should strive to follow such changes in the underlying supply and demand equilibrium for any commodity. Moreover, just because the market has already been trading in a massive trend, it does not necessarily mean that the underlying sentiment is due for change right away. The reason why the short-term trade failed was mostly due to the inherently contrarian logic that inspired it. There is nothing more detrimental for contrarian traders than the expectation of an "overdue" trend reversal when there is no evidence for this. Remember to structure your trades based on evidence, not your opinions of what the market 'should be doing' instead.
Disclaimer: Your capital is at risk! Trading and investing on the financial markets carries a significant risk of loss. Each material, shown on this website, is provided for educational purposes only. A perfect, 100% accurate method of analysis does not exist. If you make a decision to trade or invest, based on the information from this website, you will be doing it at your own risk. Under no circumstances is Trendsharks responsible for any capital losses or damages you might suffer, while using the company’s products and services. For more information read our Terms & Conditions and Risk Disclaimer.


