The EURCAD fell with more than 2 per cent over the last couple of weeks, and the general market sentiment is starting to become distinctly bearish, which poses the question of how low can the euro continue depreciating before it finds support? The euro's descent over the current period is mostly driven by ripples in the global stock market, as general market uncertainty was reinstated on the outset of 2020. The market was finally starting to breathe normally after the signing of Phase One in the trade negotiations between the US and China when panic from the novel coronavirus – COVID-19- started to surge to overshadow the temporary trade optimism eventually. The Eurozone economy, which is especially fragile and just one step away from entering into a structural recession, was immediately impacted by this new adverse uncertainty, which correspondingly hit the euro. On the other side of the coin, the Canadian economy has been able to show some signs of resistance to these new global tensions. As a result of that, the Canadian dollar has exhibited more resilience compared to the euro.
The purpose of this analysis is to present a comparative review of the two economies and their currencies’ present standings, and therefore to demonstrate the most likely future development of the EURCAD pair.
1. Long-Term Outlook:
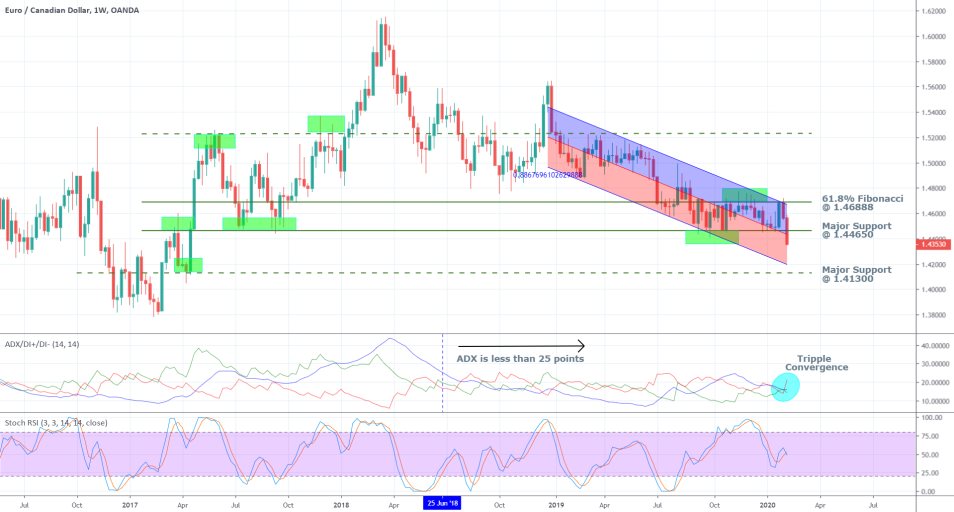
The weekly chart from below illustrates the past price action of the EURCAD, which can be characterised as threading in a weak bearish trend. This has been the case since June 2018, past which date the price action has verged into a consolidating range trading environment. As per usual, the nature, or rather the sentiment, of the price action is determined using the Average Directional Index (ADX). As can be seen, the ADX has been threading below 25 index points since June 2018, which confirms the previous observations. Additionally, a tight consolidation range becomes quite clearly visible on the chart, threading in the area that is contained in-between the two most recent green rectangles. In other words, the upper boundary of the range is at the 61.8 per cent Fibonacci Retracement level at 1.46888, and the lower-boundary is positioned at the major support level of 1.44650.
Last week’s candle has broken down below the boundaries of set consolidation range, which begs the question whether the price would manage to sustain the bearish sentiment and continue adding to the downswing in the forthcoming days. Or whether this would turn out to be a false break down and the price would soon change its course and revert itself back within the boundaries of the range.

The stochastic Relative Strength Index (RSI) has recently fallen from the 'Overbought' area, which is demonstrative of heightened activity amongst bears and therefore affirms the aforementioned bearish sentiment. Nevertheless, the stochastic MA crossed over the RSI last week, which is illustrative of renewed interest amongst bulls and heightened overall demand. In other words, more long orders were opened last week when the priced reached the low around 1.43500, which is an indication that the bulls do not anticipate the current downswing to remain active for much longer. Consequently, they have started to weigh in on a likely reversal in the price’s direction in the forthcoming days. Such a corrective movement can either reinstate the previous range trading environment, or it could prove to be nothing more than a short-term pullback in a predominantly bearish downswing.
While the advanced arguments in this initial point have so far listed the evidence supporting the likely formation of a correction in the price's current direction, the rest of the arguments in this first point highlight the evidence supporting the contrary – the possible continuation of the recent downswing.
The regression channel outlines the trajectory of the price action. As can be seen, last week's candle has not only broken down below the major support at 1.44650, but it has also broken down below the regression channel's middle line. This indicates the strengthening of the general bearish sentiment and could be taken to represent the likely continuation of the current downswing. Moreover, the channel's lower boundary is currently approaching the next major support level at 1.41300, which means that the longer-term goal of the currently developing downtrend could converge towards that same level.
Getting back to the Average Directional Index, it can be seen that the ADX itself, the DI – and the DI +, have all cut across each other recently. Such crossovers typically indicate sudden changes in the prevailing market sentiment, especially following a prolonged period of muted price action. In the context of the current market setup, this could very likely indicate the early stages in the development process of a new major bearish trend.
2. Fundamental Factors to Consider:
- In the Eurozone. As it was already mentioned, the rising fears stemming from the coronavirus’s spread are already weighing down on European stocks and on the general economy in the bloc. There are, however, other economic factors which need to be considered.
Last Friday it was announced that the German economy’s growth rate has remained flat at 0.00 per cent in the fourth fiscal quarter of 2019. These negative results in the bloc’s largest economy manifest just how close Germany is to entering into a structural recession. Most market experts now anticipate it to contract in Q1 of 2020. At the present rate, such fears represent a major impediment to the strengthening of the euro.
The German government, which is currently running the highest budget surplus in the Eurozone, would have to finally agree to increase its overall spending in order to match its fiscal policy to the already accommodative monetary policy. Before that happens, however, it is unlikely that its growth rate would be able to pick up solely based on the considerable liquidity that is available in the bloc.
Finally, the most recent findings of the ZEW economic sentiment index in Germany are scheduled for release tomorrow, which is anticipated to bolster the volatility levels in all euro-pairs additionally. The consensus forecasts project the overall economic sentiment to fall in January to 20.0 index points from December’s 26.7, which, if realised, would strain the euro in the short-term and likely cause it to fall immediately after the release of the statement.
- In Canada. In Canada, the situation is very different, and the prevailing economic optimism is not as impeded as it is in Europe. Unemployment fell by 0.1 percentage points in January to 5.5 per cent, and inflation remained solid at 2.2 per cent for the second consecutive month. Both of these indicators have had a positive impact on the Canadian dollar so far this month.
Additionally, the price of crude oil was stabilised for the first time in five weeks, as it registered its first weekly gain last Friday by rising with 3.50 per cent. Though no major reversals in the direction of the price are expected to take place in the mid-term, this momentary correction has had a positive impact on the loonie, which has a very strong positive correlation with the price of crude oil. That is because Canada is one of the biggest exporters of the precious commodity and its economy benefits greatly when the price of crude appreciates. Overall, the short-term boost in gas and oil prices are likely to strengthen the Canadian dollar, especially against already strained currencies such as the euro.
3. Short-Term Outlook:
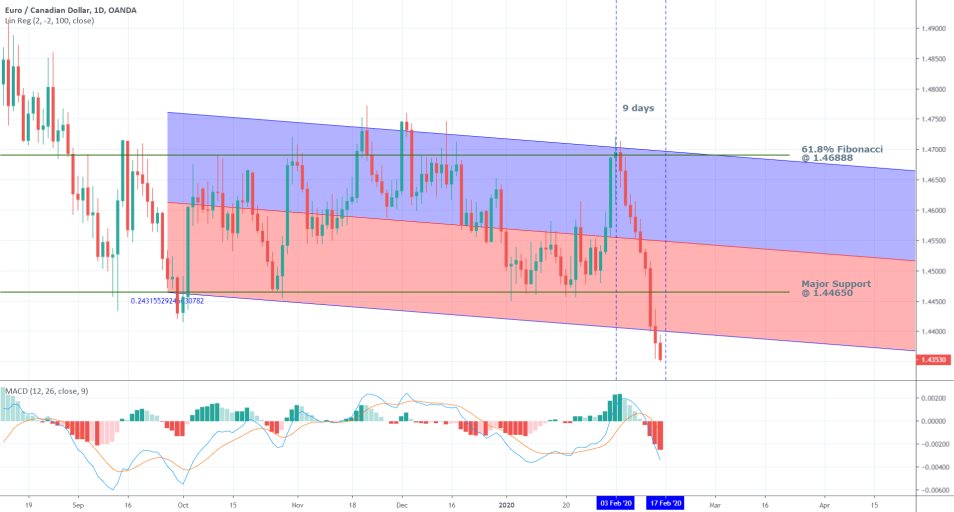
The daily price chart confirms the strong bearish sentiment. The EMA has already crossed below the MACD, and the stochastic has turned negative, both factors indicate strengthening bearish momentum. The bearish convergence is likely to continue developing as the downswing extends its gains.

The daily price chart utilises a linear regression indicator (not to be mistaken with the regression channel from the weekly chart above), which represents a mid-term channel as opposed to the long-term channel that was present on the weekly chart. Evidently, the price broke down below the channel's lower boundary last Thursday. This is a piece of strong evidence in favour of the likely establishment of a new major downtrend on the weekly chart; however, it also increases the chances for the formation of a short-term pullback to or above the boundary of the linear regression channel. In other words, the breakdown confirms the strong long-term bearish sentiment, however, most bulls would be anticipating the formation of a likely correction to occur soon, which is supported by the short-term behaviour of the RSI on the weekly chart above.
The 7-day trading strategy further supports such expectations. Essentially, whenever the price of a given financial instrument has either been rising or falling for seven consecutive days, the likelihood for the formation of a corrective swing past the seventh day is increased proportionately. Thus, every new trading day in which the price continues to move in the same direction increases the chances for the occurrence of a new corrective swing. As can be seen from the daily chart above, the price currently finds itself on the 9th consecutive day of depreciation, which coincides with the breakdown below the linear regression channel’s lower boundary. Both factors indicate the considerable likelihood for the formation of a short-term bullish correction.

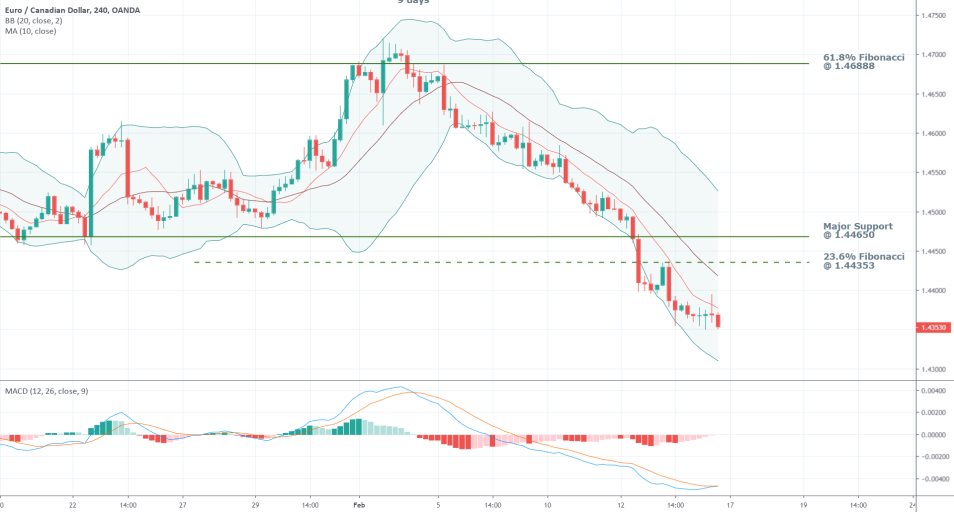
The 4H price chart further supports such expectations. The MACD appears to have reached a dip, which could very likely prompt the bulls to step up and increase the aggregate volume of long orders. The Bollinger Bands are markedly wide, which indicates heightened volatility in the market. Such conditions presuppose the formation of adverse price swings and price corrections in the opposite direction to the one of the prevailing trend.
If a bullish correction does indeed form, its most likely target-level would be the 23.6 per cent Fibonacci Retracement level at 1.44353. Whether or not the price manages to extend its gains past that level remains to be seen.
4. Concluding Remarks:
Overall, there are no fundamental and geopolitical events in sight that could change the economic landscape currently weighing down on the euro. Thereby, the currency is likely to continue being pressured by bearish sentiments in the mid-term until any profound fundamental changes take place in the Eurozone’s economy. For that reason, long-term selling orders are likely to continue driving the EURCAD lower for the foreseeable future in the mid-term.
In the short-term, however, the situation is slightly different. The price is likely to pull back to at least the 23.6 per cent Fibonacci retracement at 1.44353. If the price manages to reach past that level or even slightly higher, this will create excellent opportunities for bears to execute additional selling orders at a discount. They would be looking to enter short at the peak of the bullish correction in anticipation for the continuation of the development of the long-term bearish downswing.

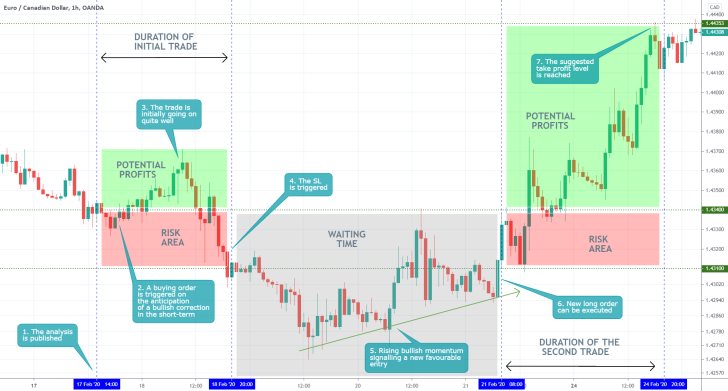
- The longer-term view of the analysis was completely mistaken in that the EURCAD started to rise by the end of the month. This, however, was prompted by the new role of the euro as a safe-haven currency during the coronavirus crisis, something that is now known in hindsight. Nevertheless, the proposition for the execution of a long order still yielded some positive results.
- The first trade would have resulted in a loss after the stop loss was triggered on the 18th of February. With enough persistence, however, a second position could have been opened on the same setup on the 21st of February. Evidently, the market was not ready to rise the first time, but the bullish momentum was enough the second time. Hence, the price action reached the suggested target level at 1.44353 around the 24th of February. The big takeaway here is to stay calm and continue to monitor the development of the market, even if one or two trades do not pan out as expected. Trading is not a one-off thing, rather, often times you'd have to execute several trades on the same market setup until you gain favourable entry and catch the next directional swing.
Disclaimer: Your capital is at risk! Trading and investing on the financial markets carries a significant risk of loss. Each material, shown on this website, is provided for educational purposes only. A perfect, 100% accurate method of analysis does not exist. If you make a decision to trade or invest, based on the information from this website, you will be doing it at your own risk. Under no circumstances is Trendsharks responsible for any capital losses or damages you might suffer, while using the company’s products and services. For more information read our Terms & Conditions and Risk Disclaimer.


