The recent rise in the demand for the precious commodity stemmed from the resurgence in COVID-19 cases in the US and elsewhere, as governments continue to ease containment restrictions. Owing to the once again growing numbers of confirmed cases, the global uncertainty that continuously casts a shadow over the prospects for economic recovery is once again heightened.
Consequently, investors worldwide started flocking towards safe-haven assets yet again, in order to hedge their portfolios against unknown risks. These developments also help explain the most recent rally on gold's price, which is currently nearing the 1800.00 benchmark.
However, the demand for low-risk securities could be offset following the publication of FED's stress tests' results. In the report from yesterday, it was revealed that the US banking sector is ready to weather an even more detrimental recession, which, in turn, is likely to bolster investors' confidence in the stability of the financial systems. In other words, the demand for safe-havens is expected to be at least partially offset in the following days, despite the continuous rise in new COVID-19 cases.
That is why the purpose of today's analysis is to examine the behaviour of gold's price action, and to determine just how low could a potential bearish correction go.
1. Long-Term Outlook:
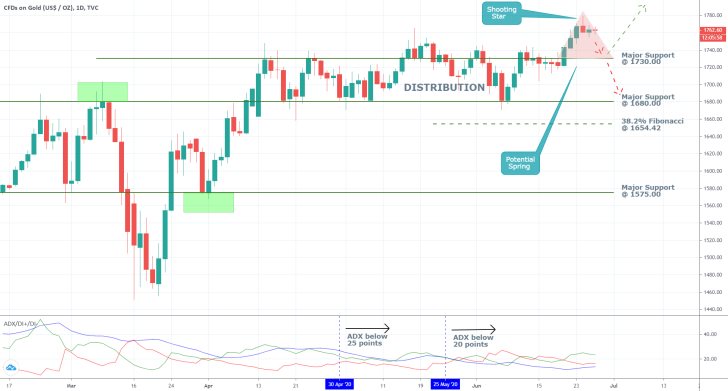
The results from the aforementioned spike in demand can be seen on the daily chart below. Gold had been trading in a broad consolidation range since mid-April, which is almost certainly a Distribution range with an upper boundary represented by the major support (previously resistance) level at 1730.00, and lower boundary encapsulated by the major support level at 1680.00.
Last week's attempt at forming a breakout above the Distribution's upper limit is promptly turning into a Spring formation – a known part of the Wyckoff cycle, encompassing failed attempts at establishing new Markups after the termination of preceding Distributions. So, unless the price action manages to continue trading higher – something that is quite unlikely if the demand for safe-havens does indeed wane in the foreseeable future- the presently evolving pattern could represent an early opportunity for the execution of short orders.

The most substantial confirmation of the earlier assertions is represented by the ADX indicator, which has been threading below 20 points since the 25th of May, and below 25 points since the 30th of April. The underlying price action is currently being affected by the existence of a very robust range-trading environment. Under these conditions, gold's price is much more likely to head back towards the range's lower boundary, as opposed to continuing to advance further north.
The first goal for the price action would be to fall back towards the 1730.00 level, and if it manages to break down below it, the next target level would be the major support at 1680.00. Depending on the strength of the underlying bearish commitment, the market could even attempt to break down below the Distribution range's lower limit and head towards the 38.2 per cent Fibonacci retracement level at 1654.42.
The currently rising bearish sentiment is confirmed by the 'Shooting Star' candlestick, which is found at the recent swing high. These candles typically entail the likely termination of the recent upswing and the possible establishment of a new downswing.
2. Short-Term Outlook:
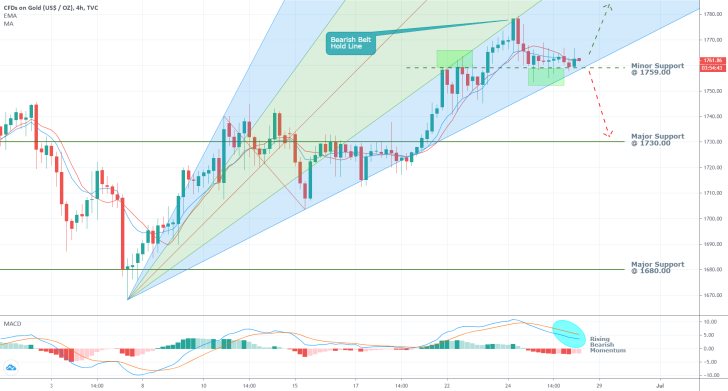
As can be seen on the 4H chart below, the price action is currently being contained within the lower portion of the pitchfan tool's area. The following behaviour of the price action is going to be quite telling of whether the emergence of a new downswing towards the major support level at 1730.00 can be expected.
As can be seen, the pitchfan's lowest edge coincides with the minor support level at 1759.00. A breakdown below the two is going to represent the necessary confirmation that the market is ready to start falling towards the first significant target level. That is so because the pitchfan's boundaries represent potential turning points for the direction of the underlying price action.
For instance, the previous bearish belt hold line rebounded from an intermediate boundary, so the same could happen again. This would be true for as long as gold's price remains contained within the area of the pitchfan.

The MACD is demonstrating rapidly rising bearish momentum in the short-term, which is inlined with our primary expectations, and would support the establishment of a new downswing. Additionally, the 10-day EMA (in blue) recently crossed below the 10-day MA (in red), which is also something to be expected before the price action moves in to develop a new significant markdown.
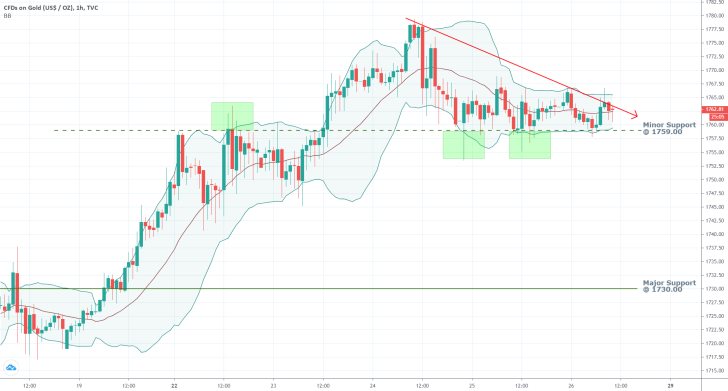
As can be seen on the hourly chart below, the price action remains concentrated below the downwards sloping trend line, which represents yet another confirmation of the rising selling pressure in the very short-term. Accordingly, the Bollinger Bands have contracted quite noticeably, which means that the underlying volatility is especially subdued at present.
Both of these factors are illustrative of the market's preparation to attempt breaking down below the minor support level at 1759.00. If it should succeed, then the newly evolving downswing would be confirmed.

3. Concluding Remarks:
Both the underlying fundamentals and the behaviour of gold's price action around the aforementioned crucial test levels, seem to suggest that the market is moving forward towards attempting a new markdown. Its ultimate success would mostly depend on the price action's behaviour around the aforementioned minor support level.
At any rate, even if the recent bullish upswing is to be continued in the longer-term, the establishment of at least a minor intermediate bearish correction towards the first major support level seems more than plausible. This, too, would open up possibilities for the execution of selling orders in the short run.

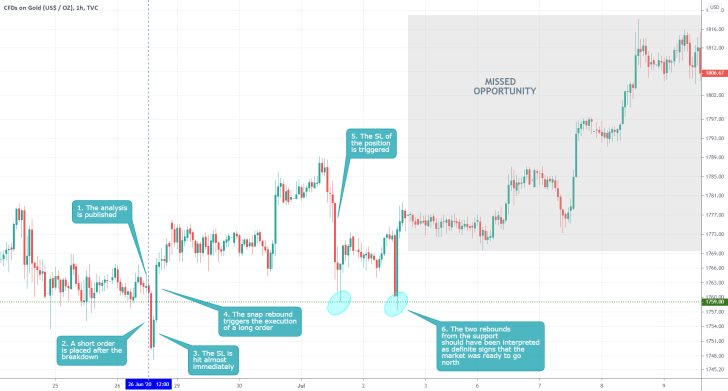
- The long-term projections of the analysis were completely mistaken, which impeded the performance of the trade. The saving grace of the analysis was the successfully plotted levels of support and resistance. The above setup demonstrates the need for traders to maintain composure and patience in order to catch market developments that take longer time to get fully established. There was plenty of underlying evidence confirming the reinvigorated bullish sentiment.
Disclaimer: Your capital is at risk! Trading and investing on the financial markets carries a significant risk of loss. Each material, shown on this website, is provided for educational purposes only. A perfect, 100% accurate method of analysis does not exist. If you make a decision to trade or invest, based on the information from this website, you will be doing it at your own risk. Under no circumstances is Trendsharks responsible for any capital losses or damages you might suffer, while using the company’s products and services. For more information read our Terms & Conditions and Risk Disclaimer.


