The EURUSD pair currently finds itself in a firm downtrend, which looks poised to continue depreciating soon. In fact, the underlying price action is currently establishing a minor bullish correction that likely serves the role of an intermittent break in the development of the broader downtrend. It remains to be seen whether this correction's completion will be followed by continued price depreciation, which is what all underlying factors seem to suggest.
At the highly anticipated monetary policy meeting of the European Central Bank from earlier today, the Governing Council of the bank decided to leave the key rates unchanged at their current near-negative levels. The euro was not bolstered by this policy decision, which presupposes the likely continuation of the single currency's weakening.
Meanwhile, the American economy remains on track to a robust recovery, which is likely to continue supporting the recuperation of the dollar. Inflation is growing at a faster pace in the U.S. compared to the Eurozone, while labour market expansion is also gaining momentum on the other side of the Atlantic.
All in all, the greenback seems poised to continue appreciating against the euro, which is inlined with the expectations for another bearish rebound on the pair.
1. Long-Term Outlook:
As can be seen on the daily chart below, the EURUSD is currently transitioning within different stages of the Wyckoff Cycle. Namely, the underlying price action appears to be completing a Distribution range, which is likely morphing into a new Markdown. These expectations were substantiated following the completion of the bullish throwback to the Distribution's lower boundary (the major resistance level at 1.215000), which was followed by renewed price depreciation. Notice that the throwback itself takes the form of an Evening Star pattern with a massive Shooting Star candle in the middle, anticipating the continuation of the Markdown's further development.
The Markdown itself takes the form of a descending channel, manifesting a 1-5 impulse wave pattern, as postulated by the Elliott Wave Theory. The aforementioned throwback represents the first retracement leg of the pattern (1-2), which emerged from the channel's lower boundary. It follows that once the price action is done establishing the second retracement leg (3-4), the downtrend is most probably going to continue. This will be underpinned by the creation of the final impulse leg (4-5), potentially towards the 38.2 per cent Fibonacci retracement level at 1.16937.
There are two areas where the price action is likely to peak at point 4 - either near the upper boundary of the descending channel or around the 23.6 per cent Fibonacci retracement level at 1.19429. Seeing as how the current throwback is probing this Fibonacci barrier, there is a strong likelihood that the latter scenario ultimately pans out.
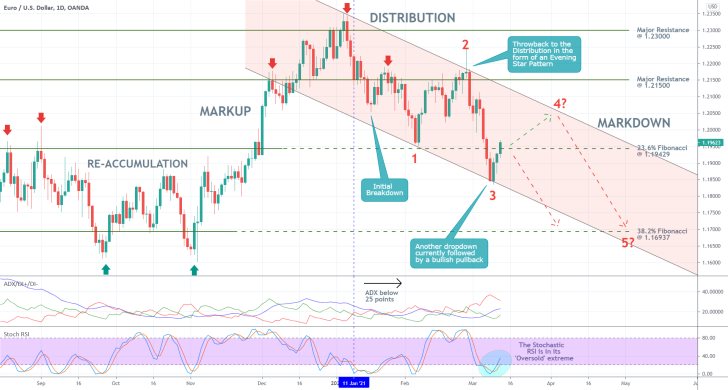
The ADX indicator is nearing the 25-point benchmark but is still threading below it. This has been the case since the 11th of January, which was when the price action reached the upper boundary of the Distribution at 1.23000. While the Markdown is still developing, the underlying environment continues to be technically range-trading.
Keeping this in mind, the Stochastic RSI indicator recently became 'Oversold', which could prompt the resurgence of some bullish pressure in the short-term. In other words, the market is indeed forming a bullish pullback at present, but once this temporary bullish pressure is exhausted, the EURUSD will be ready to resume falling. There is a very high probability that after completing this correction, the Markdown will be continued towards the 23.6 per cent Fibonacci seems.
2. Short-Term Outlook:
The 4H chart below examines the behaviour of the price action in the short-term. Notice that the aforementioned retracement leg (1-2) takes the form of an Elliott correction (ABC). Meanwhile, a case can be made that the next impulse leg (2-3) is not yet completed, contrary to what seemed to be the case on the daily chart above. This is derived from the fact that this impulse leg itself takes the form of a minor 1-5 pattern.
This minor impulse wave pattern is also in the process of establishing a 3-4 retracement leg, which is then likely to be followed by another bearish impulse. In other words, the price action's behaviour in the short-term confirms the bearish expectations derived from the daily chart above.
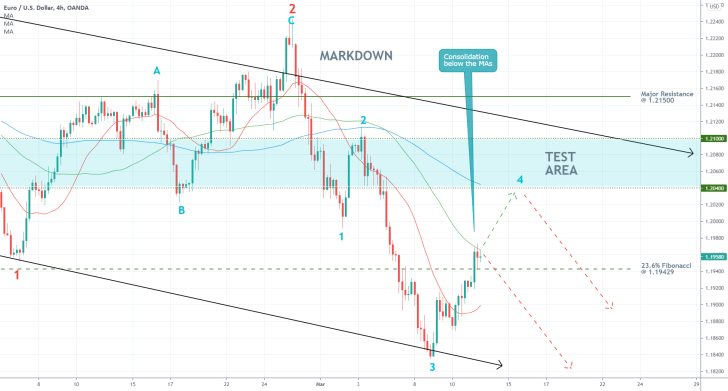
Once again, there are two plausible scenarios regarding the anticipated bearish reversal (from the expected peak at point 4). Firstly, the price action could reverse immediately and break down below the 23.6 per cent Fibonacci retracement level at 1.19429. This expectation is substantiated by the fact that, for the time being, the price action appears incapable of breaking out above the 50-day MA (in green).
Secondly, the price action could peak below (or within) the Test Area (in blue). The lower boundary of the Test Area is represented by the minor resistance at 1.20400. The latter served as a dip of AB, which further increases its prominence as a potential turning point. Moreover, the 100-day MA (in blue) is also currently crossing 1.20400, which further strengthens the expectations for a bearish reversal below it.
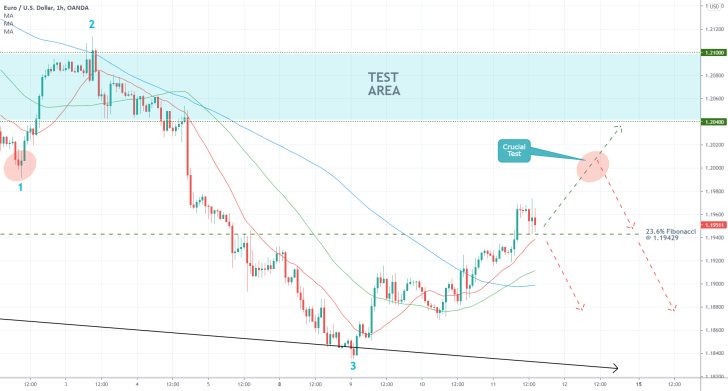
There is one final possibility for a bearish reversal, which can be observed on the hourly chart below. The EURUSD could change directions in the midpoint between the 23.6 per cent Fibonacci and the 1.20400 resistance, represented by the "Crucial Test" area. The prominence of the latter is derived from the fact that it served as a dip at point 1 (the preceding swing low).
One last thing that needs to be observed carefully is that the three moving averages - the 20-day MA (in red), the 50-day MA (in green), and the 100-day MA (in blue) - maintain a perfect ascending order in the very short-term. This should be considered mostly by market bears.
3. Concluding Remarks:
Bears can take advantage of the developing setup by joining the Markdown at the next swing peak (the highest point of the currently emerging bullish pullback). Today's analysis examined three such possible scenarios. Once the price action concludes either of them, bears will be ready to utilise trend-continuation strategies at the newly formed peak. Once again, the Markdown's next target level is encompassed by the 38.2 per cent Fibonacci Retracement level at 1.16937.
The Dollar Shakes Off the Temporary FED Pressure
The past several hours proved to be quite tumultuous for the pair. The greenback retreated following the March policy meeting of the Federal Reserve, during which Jerome Powell and his colleagues from the FOMC justified their dovish stance. But now that the initial volatility resulting from the meeting is starting to wane, the greenback has immediately begun to showcase signs of stabilisation.
The U.S. economy as a whole continues to be recovering robustly enough, which is supporting the recuperation of the greenback. This process is now likely to be accelerated even further by the government's broadened fiscal policy, which is intended to foster higher rates of consumer spending. In contrast, the euro has been plagued recently by arising uncertainty from the EU's 'hit and miss' style of handling the pandemic.
The coronavirus fallout continues to represent a major impediment to recovery for most countries within the Euro Area, which is why the ECB felt compelled to speed up its asset purchasing under the Pandemic Emergency Purchase Programme (PEPP).
All underlying fundamentals considered together, the EURUSD is more than likely to continue experiencing heightened bearish pressure in the near future. This is likely to contribute to the establishment of a new downtrend, as was anticipated by the initial analysis.
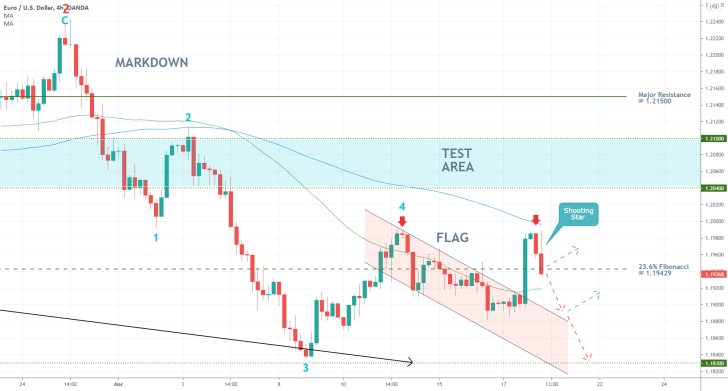
As regards the current technical outlook of the EURUSD, the price action appears to be at another crucially important test level, which is likely to signal the next direction for the pair. As can be seen on the 4H chart above, the EURUSD broke out above the 28.6 Fibonacci retracement level at 1.19429 yesterday, following FED's decision. However, the price action appears to have peaked just below the 100-day MA (in blue), which currently serves the role of a floating resistance, and has since then fallen back to the Fibonacci level, now acting as a support.
Several important factors need to be addressed here. On the one hand, the breakout emerged from the Flag pattern, which in itself represents a bullish indication. The current consolidation of the price action above the 23.6 per cent Fibonacci, including the 50-day MA (in green), can therefore end up representing a temporary break in the development of a new uptrend. The first significant test for this would be encapsulated by a breakout within the Test Area's boundaries.
On the other hand, yesterday's upsurge was terminated on the same plane as the previous swing high (point 4), which implies the creation of a Double Top pattern. This indicates a potential bearish reversal. Moreover, the newest candle takes the form of a Shooting Star, which substantiates these expectations.
Overall, if the price action manages to break down below the 23.6 per cent Fibonacci decisively, this will clear the way for the EURUSD to probe even lower. The first target for such a downswing is encapsulated by the major support level at 1.18300. Meanwhile, the 38.2 per cent Fibonacci retracement level at 1.16937 remains the next longer-term goal for the pair, as was argued in the original analysis.
EURUSD Ready to Fall Towards the Next Fibonacci Retracement, Supported by the Elliott Wave Theory
The EURUSD finally broke down below the 23.6 per cent Fibonacci retracement level at 1.19429, which confirmed the strength of the underlying Markdown. This Markdown represents the latest stage of a broader Wyckoff cycle that entails likely continuation of the bearish sentiment in the short run. Consequently, the pair now looks poised to attempt falling towards the next psychological target - the 38.2 per cent Fibonacci retracement level at 1.16937.
On the one hand, the dollar advances contrary to the stock market selloff, which is prompted by FED's expectations for faster-than-initially-anticipated recovery. The rally of the greenback is additionally strengthened by the growing demand for lower-risk securities. On the other hand, the euro is losing its appeal partly due to the same underlying changes in the existing market bias, and partly due to the recent vaccination tribulations in Europe.
Overall, the current fundamentals seem overwhelmingly bearish, which is likely to result in continued price depreciation for the EURUSD pair in the foreseeable future.
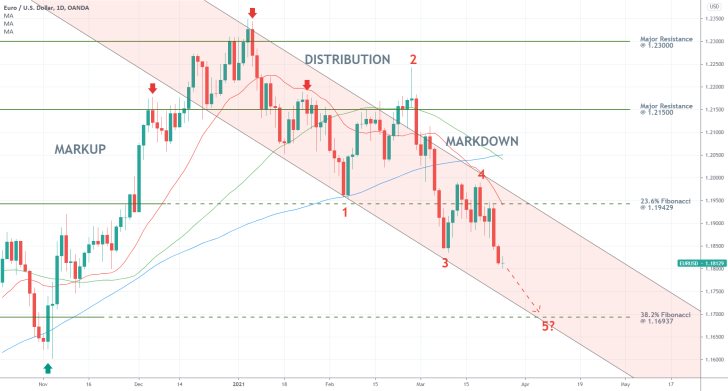
As can be seen on the daily chart above, the current follow-up picks up right from where the last one left off - the price action has broken down below the 23.6 per cent Fibonacci retracement decidedly, and the reinvigorated Markdown is now free to continue depreciating. Notice that the lower boundary of the descending channel, which encompasses this Markdown, is about to converge with the next target level - the 38.2 per cent Fibonacci. This makes it even likelier for the Markdown to test the two of them.
The temporary consolidation above the 23.6 per cent Fibonacci represented the second retracement leg (3-4) of a broader 1-5 impulse wave pattern, as postulated by the Elliott Wave Theory. The subsequent breakdown thus initiated the beginning of the final impulse leg (4-5). These projections of the EWT substantiate the aforementioned expectations for a dropdown to 1.16937.
Finally, the broader bearish sentiment is also confirmed by the recent crossover of the 50-day MA (in green) below the 100-day MA (in blue). Despite the overwhelmingly bearish outlook, however, bears should be aware of potential bullish pullbacks to the 20-day MA (in red), which serves the role of a floating resistance.
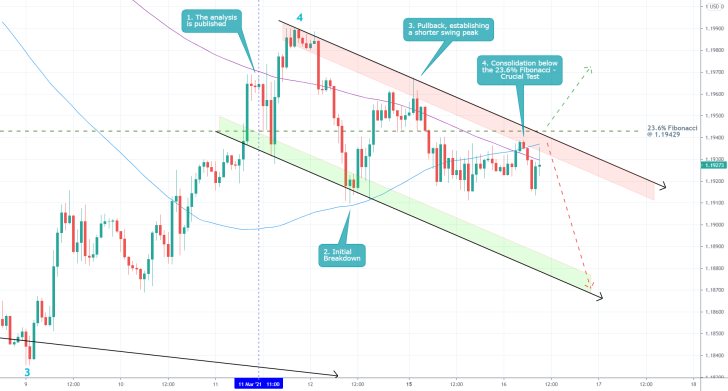
- The expectations of the initial analysis are starting to get realised. The price action developed a swing peak at point 4 (part of a 1-5 impulse wave pattern), and it now looks ready to continue depreciating. The subsequent shorter swing peak substantiates these expectations.
- Notice that the EURUSD is consolidating just below the 23.6 per cent Fibonacci retracement level, which is currently converging with the 100-day MA (in blue) and the 200-day MA (in purple), comprising a major make-it-or-break-it point.
- Provided that the price action does not break out above 1.19429 yet again, a bearish rebound from the Fibonacci barrier would further substantiate the bearish projections. Overall, the price action looks ready to continue depreciating due to the strengthening dollar, as per the original forecasts.
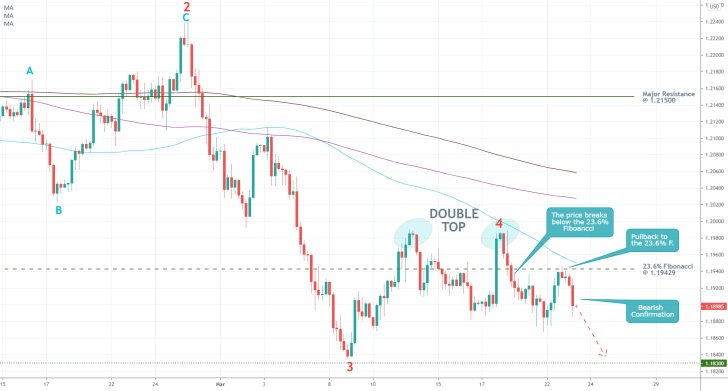
- As per the forecasts of the last follow-up, the EURUSD started probing lower. The pair broke down below the 23.6 per cent Fibonacci retracement level at 1.19429, which was then expectedly followed by a bullish pullback to the same level (now as a resistance). The latest rebound from the Fibonacci resistance confirms the robust bearish bias at present.
- Given that a Double Top pattern emerged from the 100-day MA (in blue), thereby completing the (3-4) retracement leg of a broader 1-5 impulse wave pattern, substantiates these bearish forecasts. The economic calendar this week is also favourable.
- The first target level for the renewed downtrend is encompassed by the major support level at 1.18300. Once this barrier is broken, the price action is likely to continue heading down south as part of the development of the last (4-5) impulse leg.
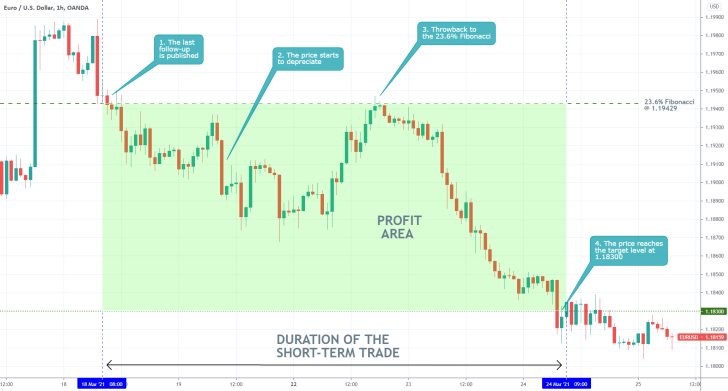
- The price action did indeed break down below the 23.6 per cent Fibonacci retracement level and subsequently hit the target level at 1.18300, as per the expectations of the last follow-up analysis.
- There is not much that can be said here, an overall perfect execution. It is worth mentioning that the timing of the follow-up's release was close to perfect, right before the price started falling.
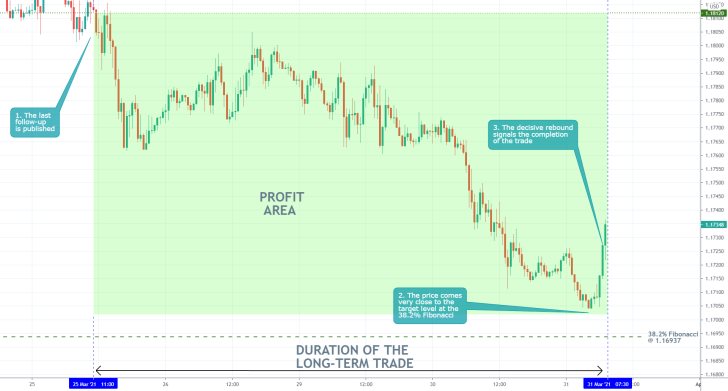
- The last follow-up projected quite successfully the continuation of the downtrend, thereby adding to the existing short position. The price action came quite close to the target level (the 38.2 per cent Fibonacci retracement level at 1.16937, but rebounded just above it. Given this decisive bullish upswing, the short order was closed there.
- Traders need to keep in mind that the price action (of any asset) is likely to behave erratically near such major turning points (significantly important levels of support and resistance), which is why they need to be prepared to act accordingly.
Disclaimer: Your capital is at risk! Trading and investing on the financial markets carries a significant risk of loss. Each material, shown on this website, is provided for educational purposes only. A perfect, 100% accurate method of analysis does not exist. If you make a decision to trade or invest, based on the information from this website, you will be doing it at your own risk. Under no circumstances is Trendsharks responsible for any capital losses or damages you might suffer, while using the company’s products and services. For more information read our Terms & Conditions and Risk Disclaimer.


